2. Getting Started
2.1. Installing easyDiffraction
2.2. Launching easyDiffraction
2.3. Uninstalling easyDiffraction
3. How to Use
3.1. easyDiffraction user interface
3.1.1. Toolbar
3.1.2. Main window
3.1.3. Sidebar
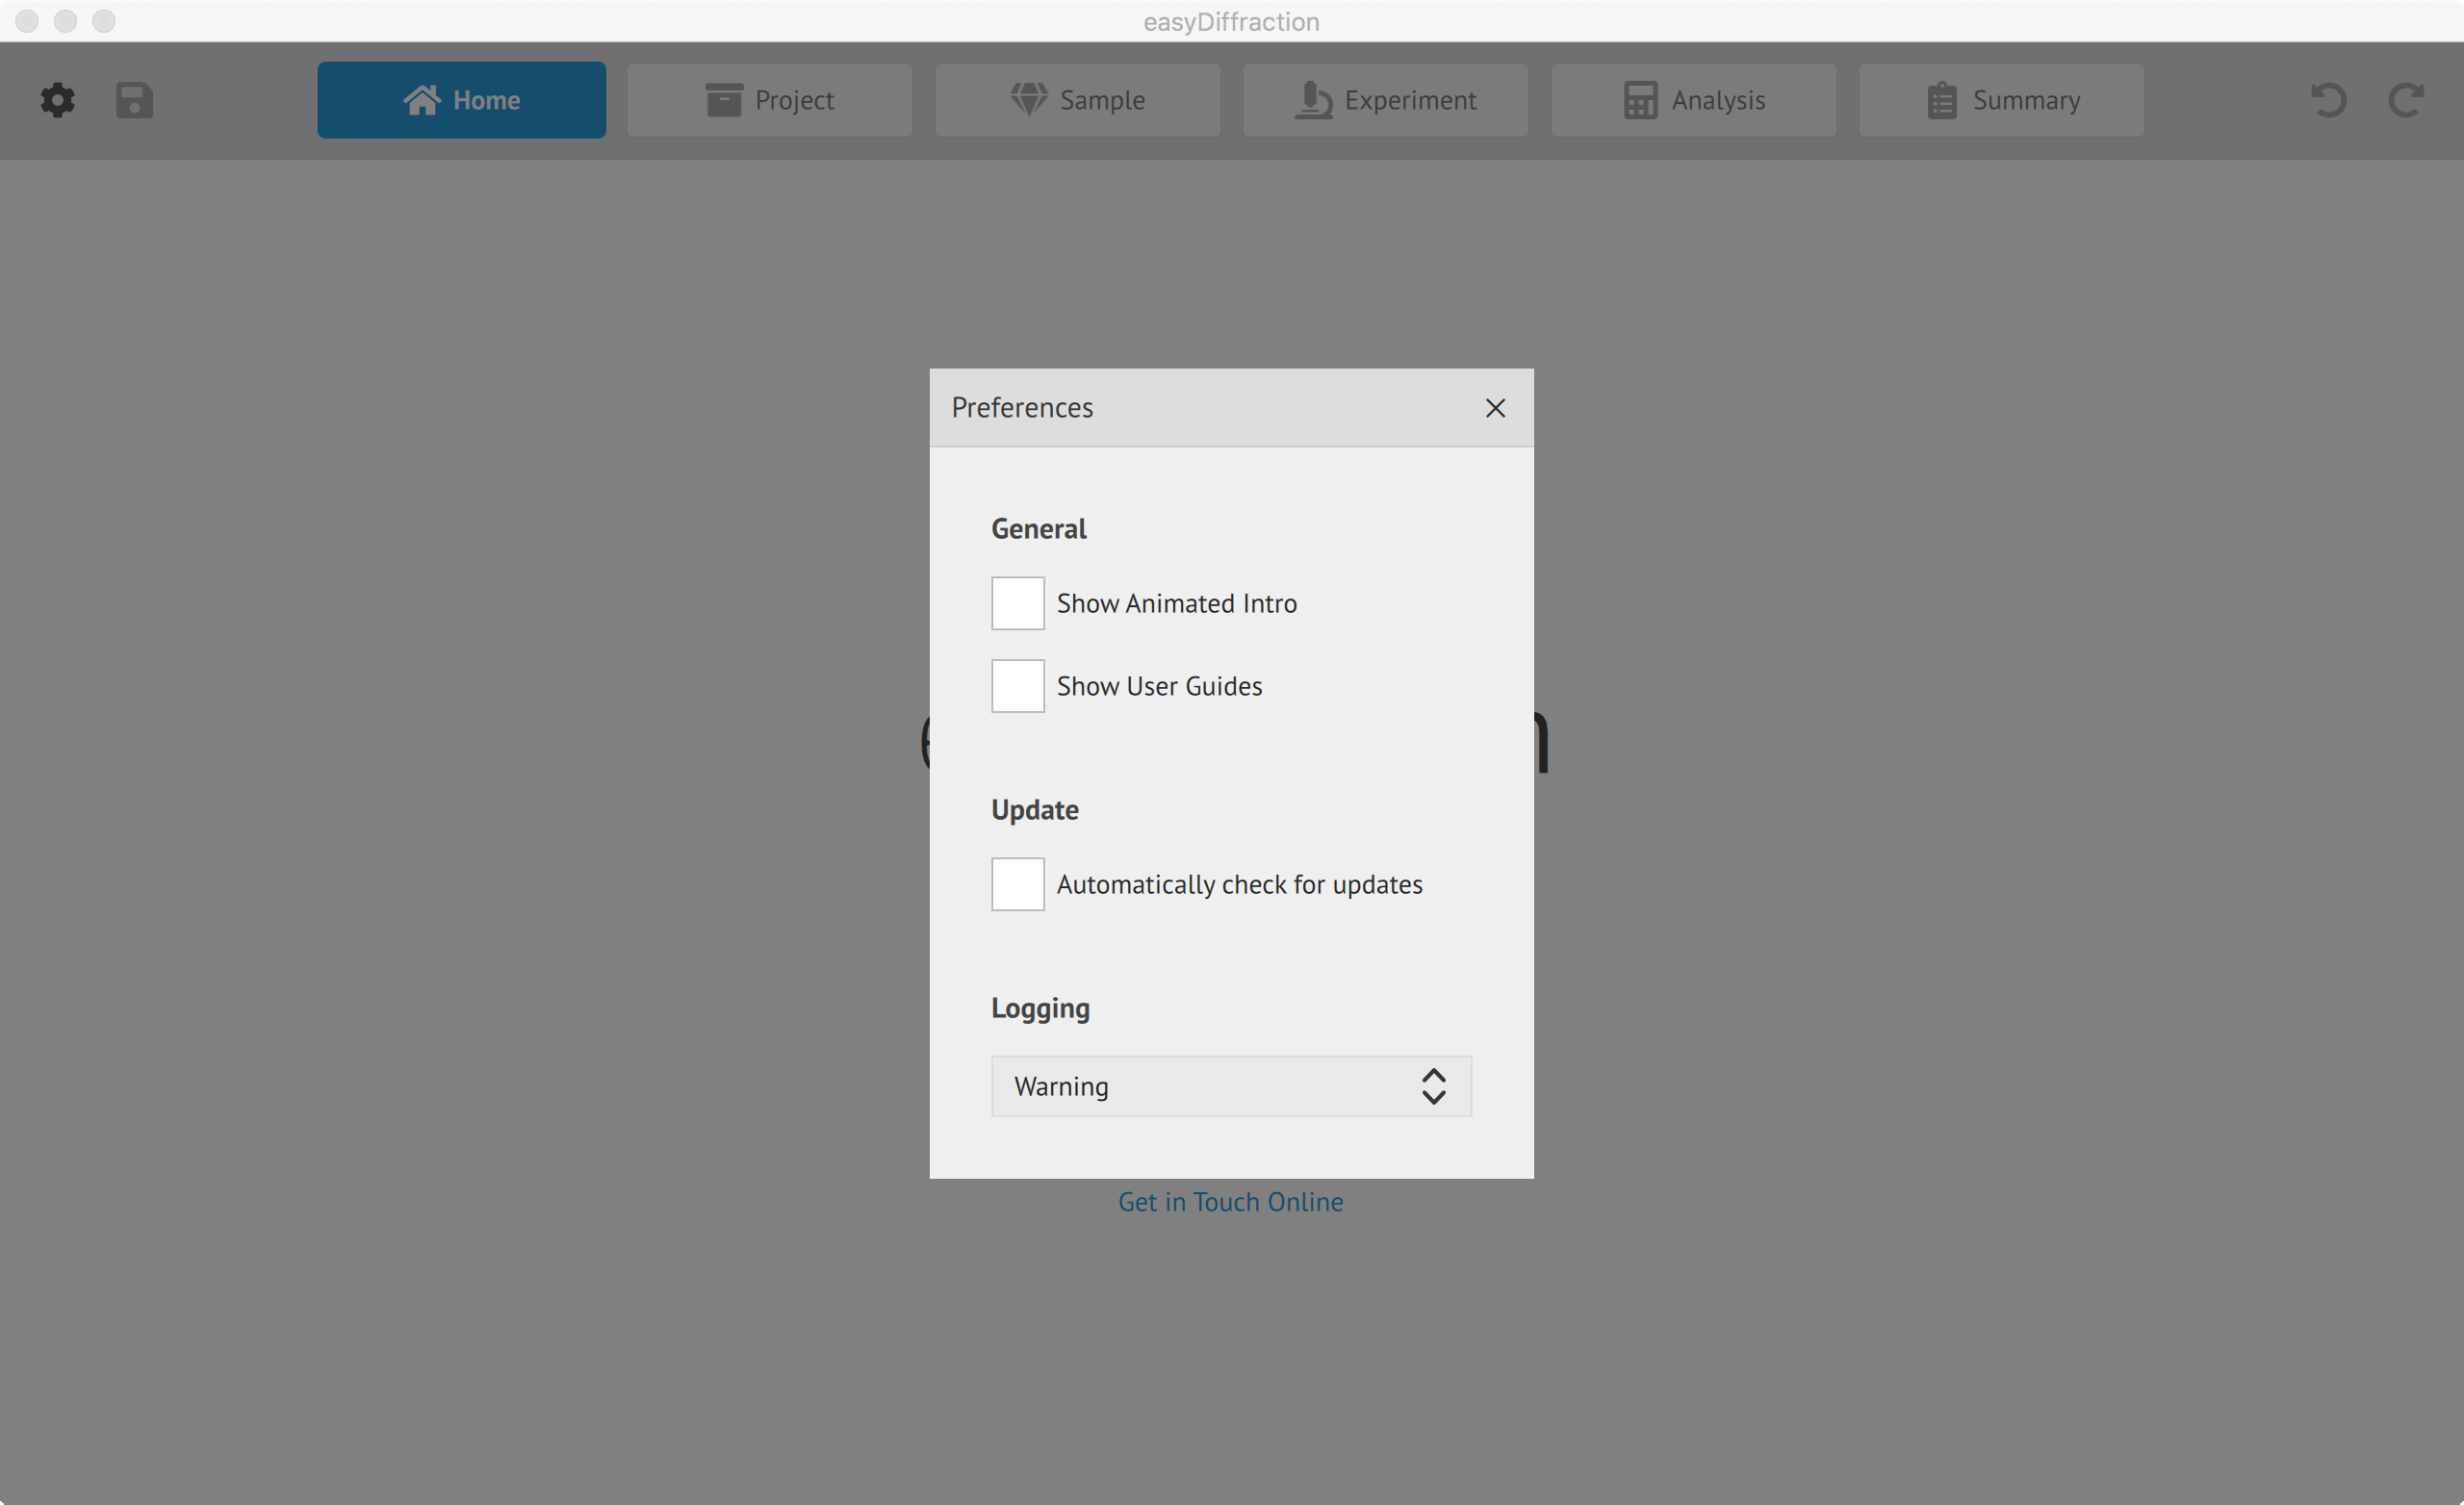
3.1.4. Settings
3.2. easyDiffraction project files
3.2.1. Unpolarized diffraction
3.2.2. Polarized diffraction
3.3. Data analysis workflow
3.3.1. Home page
3.3.2. Create/Open project
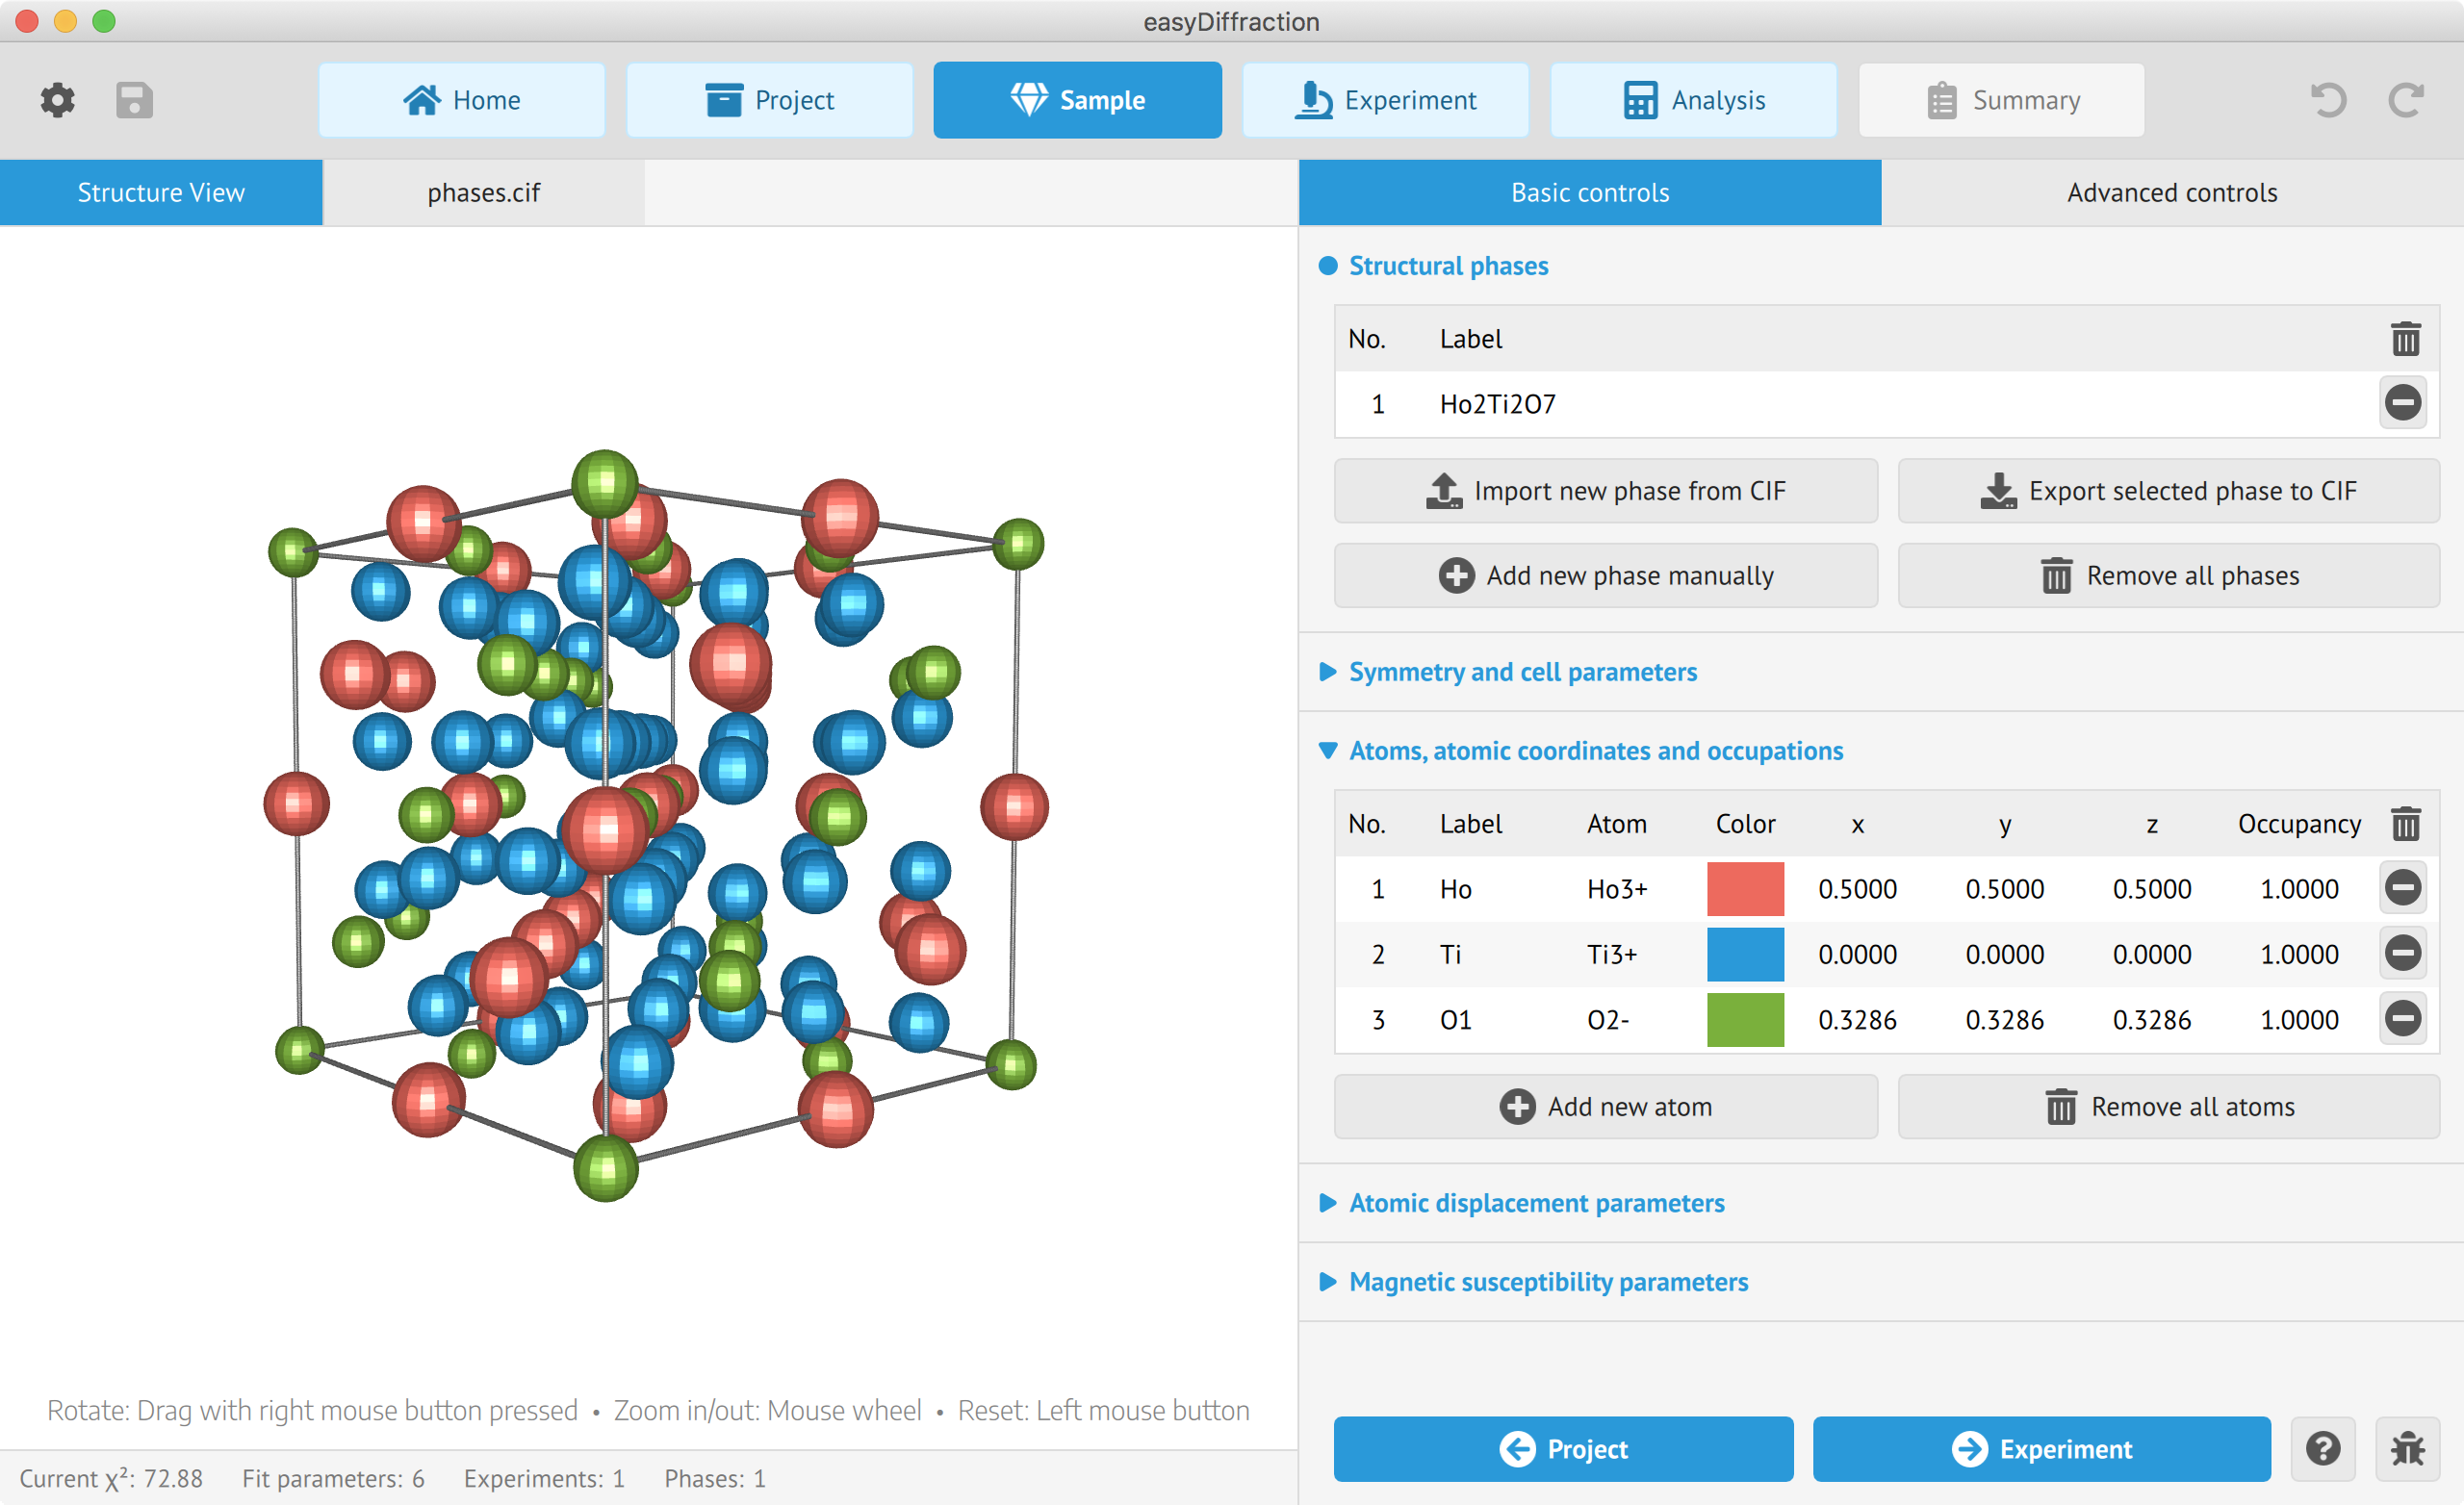
3.3.3. Define sample model
3.3.4. Load experimental data
3.3.5. Perform data analysis
3.3.6. Generate summary report
3. How to Use
In this chapter we'll look at how to work with easyDiffraction.
3.1. easyDiffraction user interface
Here you can see what the program looks like. The application window is divided into parts that provide you with quick and easy access to everything you'll need. The parts are Toolbar, Main Window and Sidebar described in the following sections.

3.1.1. Toolbar
The toolbar at the top of the application window contains three groups of buttons, indicated on the screenshot below.
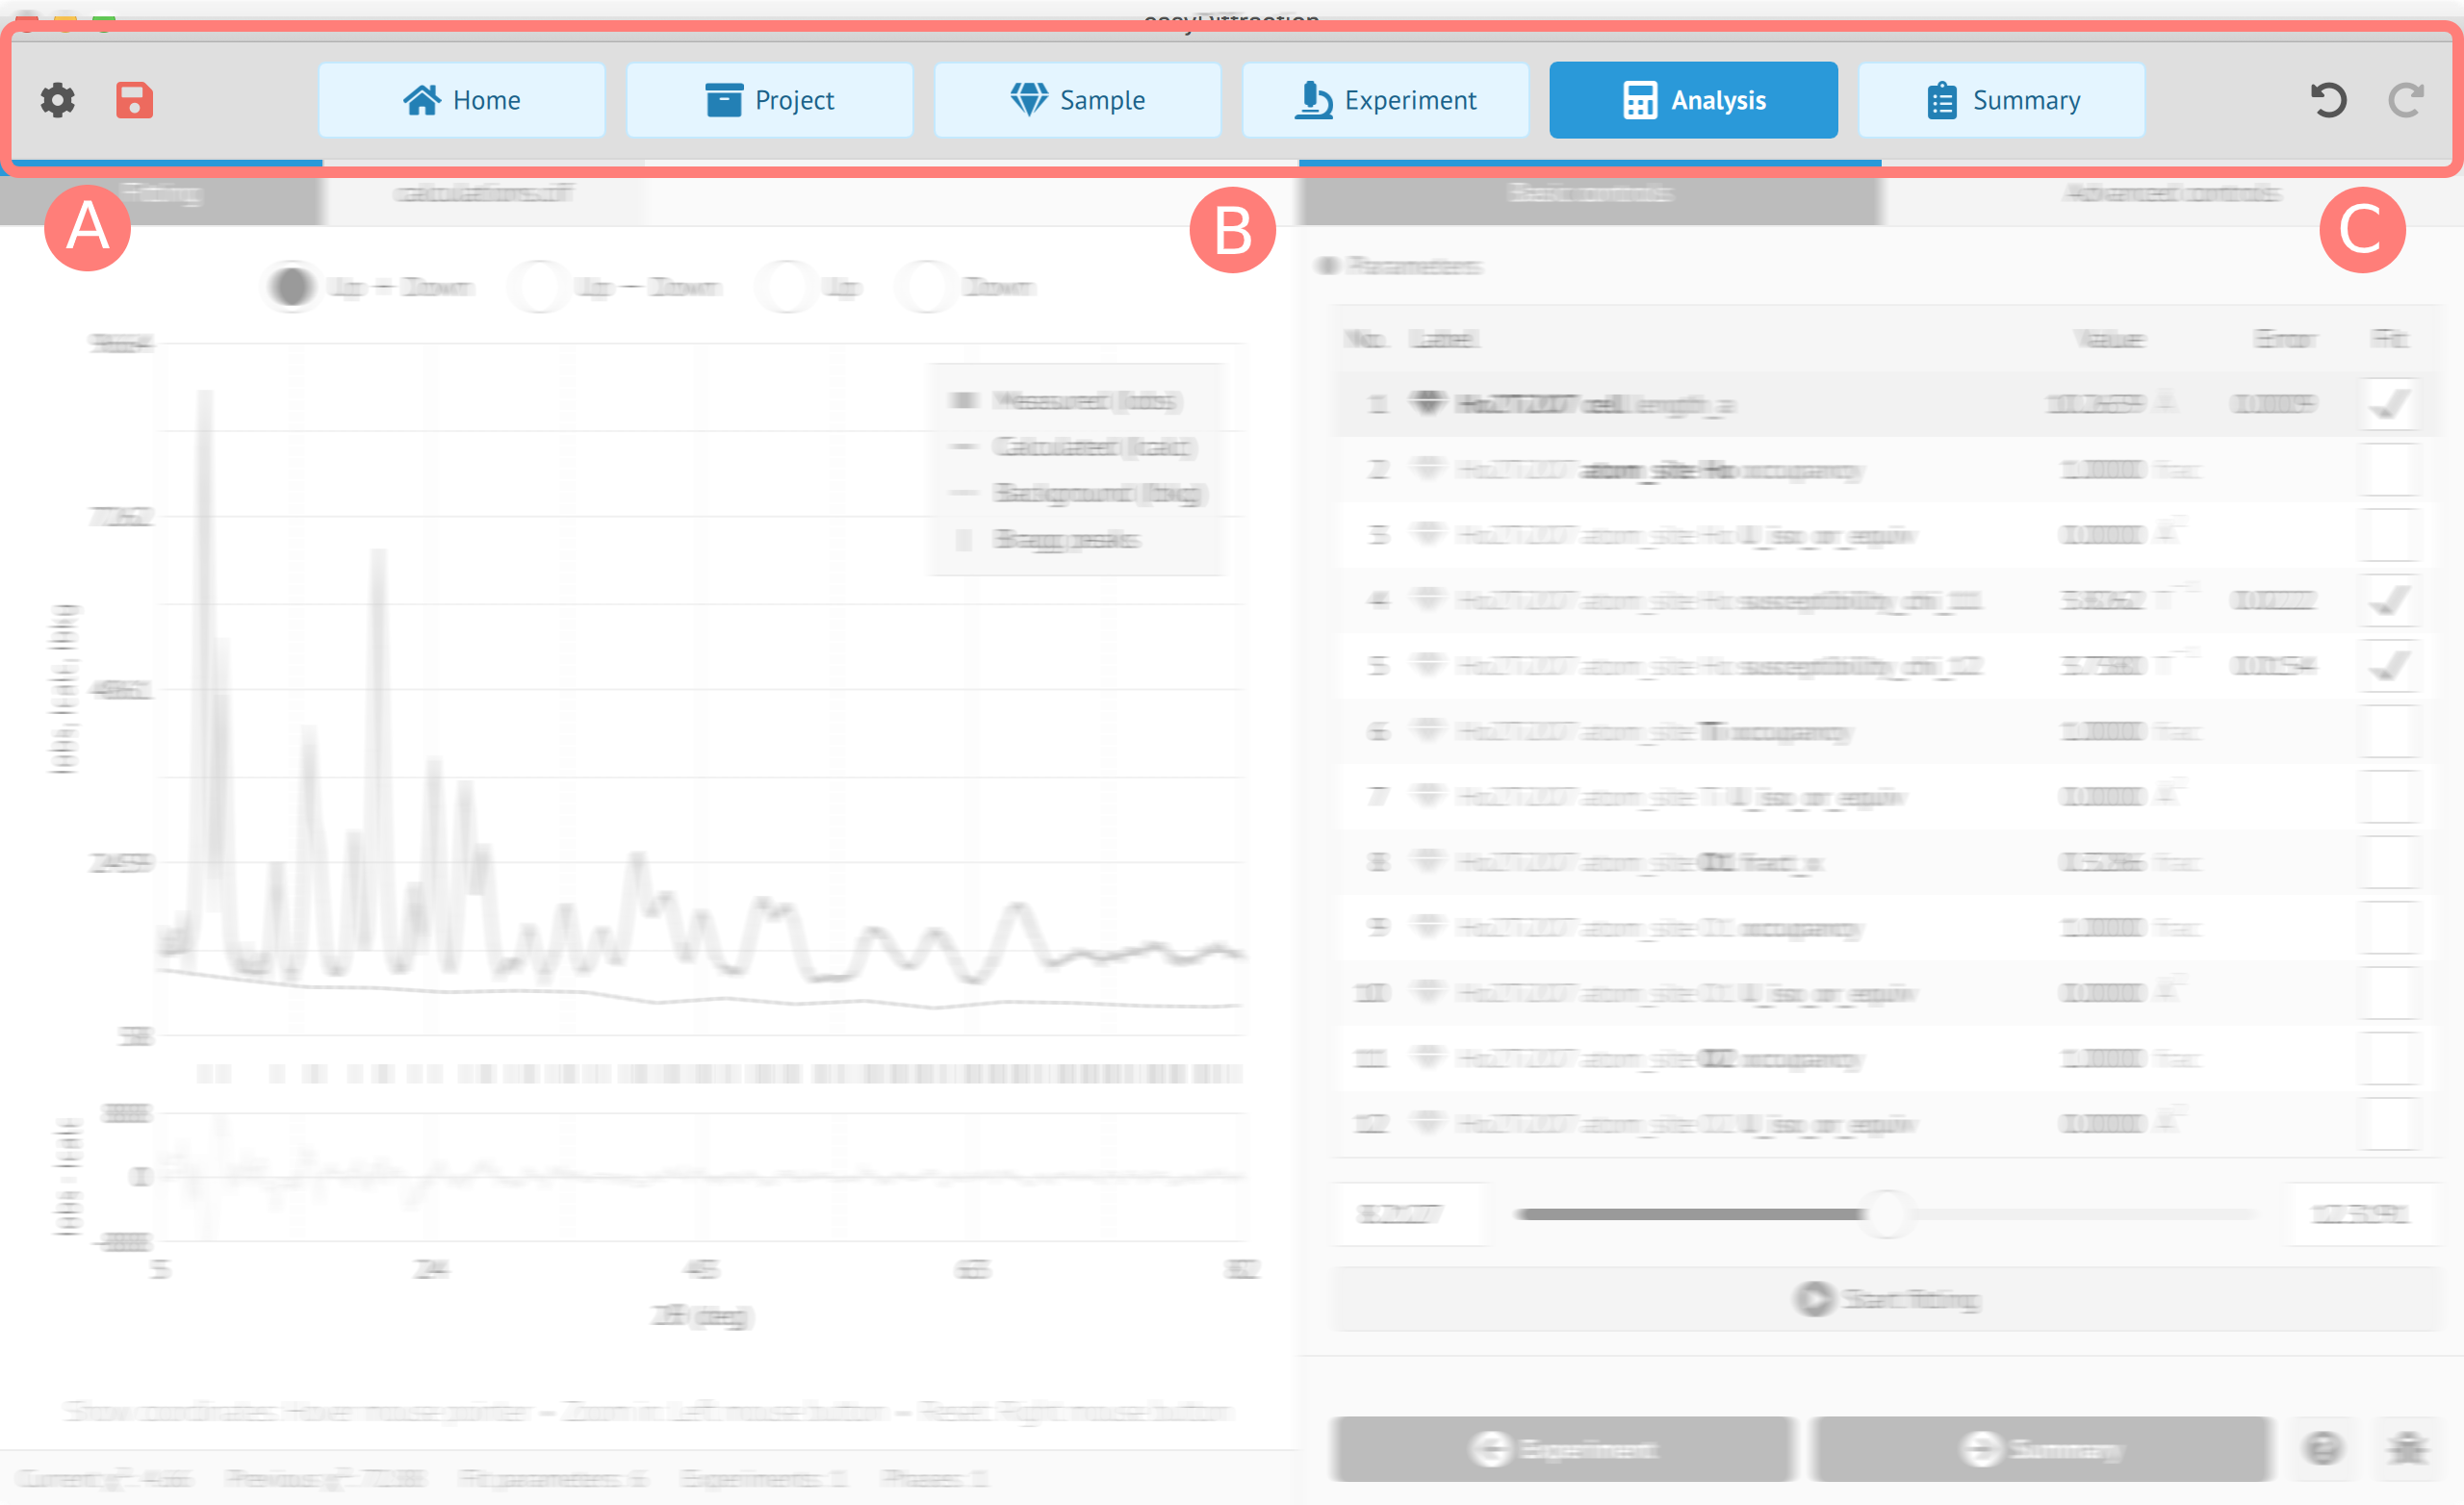

On the left side in group A the following buttons are available:
Application preferencesOpens dialog where application settings can be changed.Save current project stateSaves the current state of project to a .zip file.
The buttons in group C are undo and redo buttons that can be used if a mistake is made.
The central group of buttons, group B, represents the data analysis workflow. When you create a new project,
all toolbar workflow buttons except Home are disabled. When each step in the workflow is completed,
the toolbar workflow button which corresponds to the next step becomes enabled.
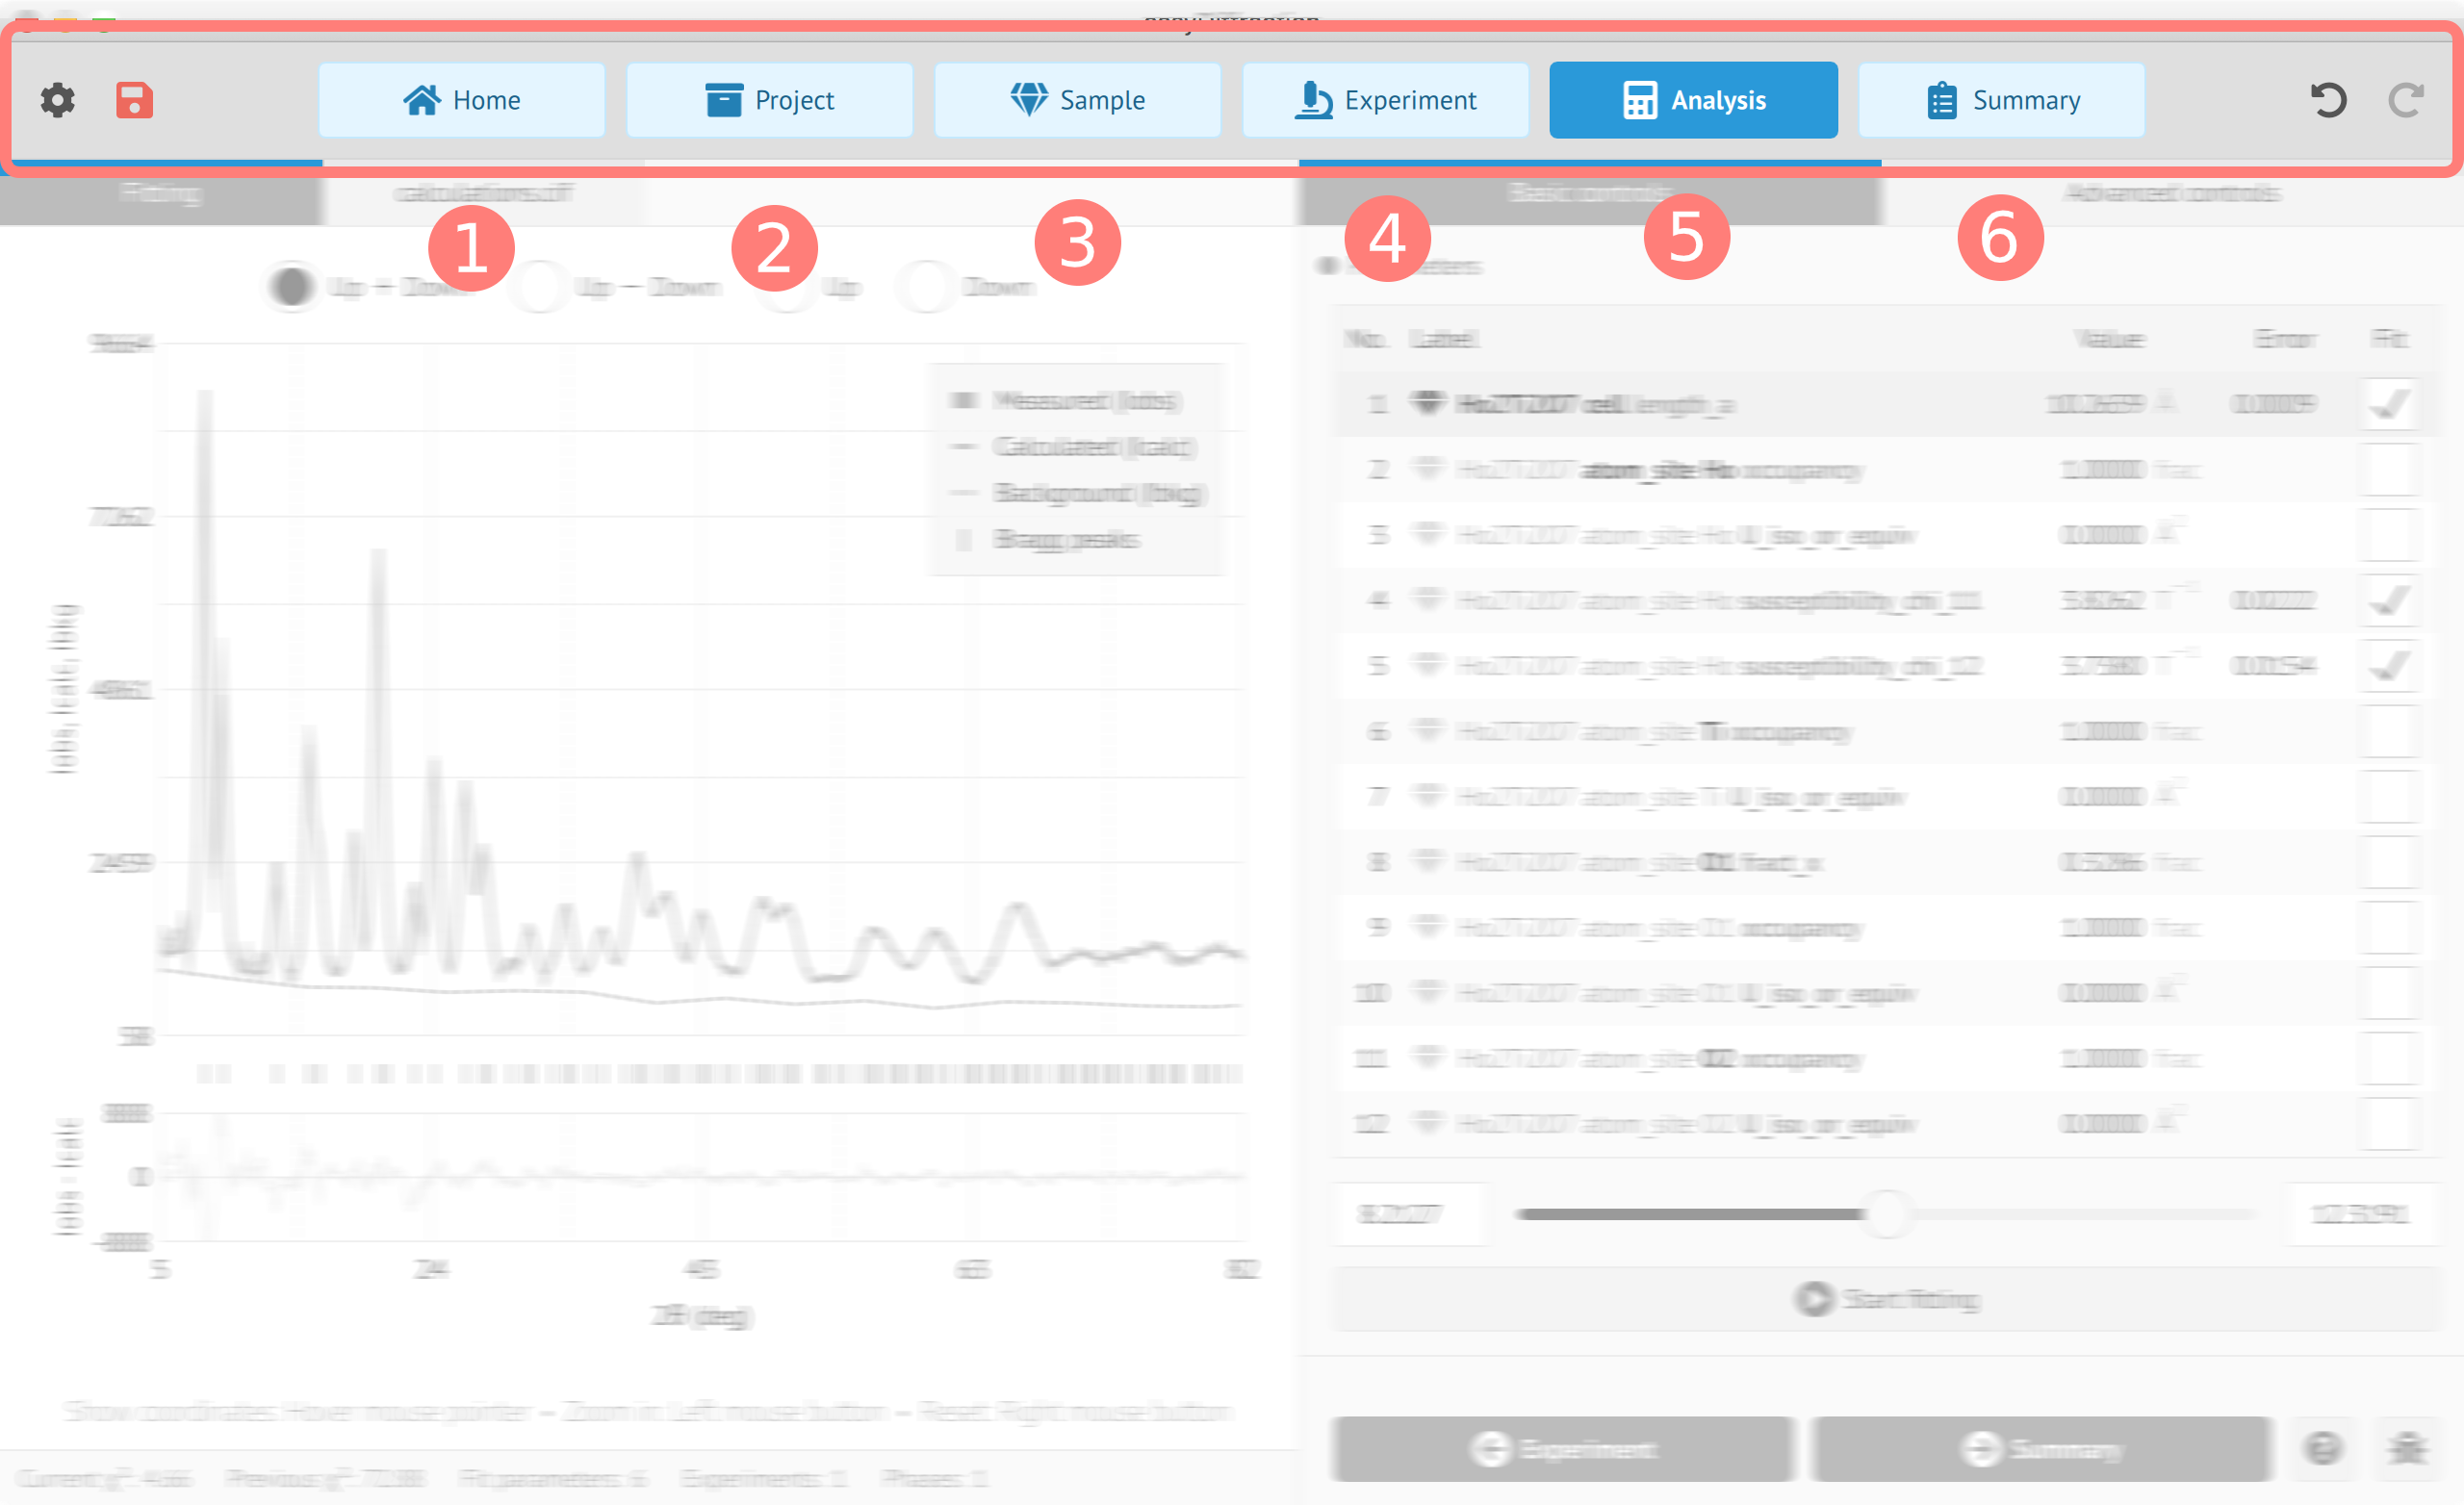

The following workflow buttons (workflow steps) are present in the easyDiffraction toolbar:
Homeintroduction page, links to about, help and contact.Projectto manage your project (create new, open existing, etc.)Sampleto describe sample phases.Experimentto load experimentally measured data files.Analysisto perform refinement of structural parameters.Summaryto view and export summary report.
3.1.2. Main window
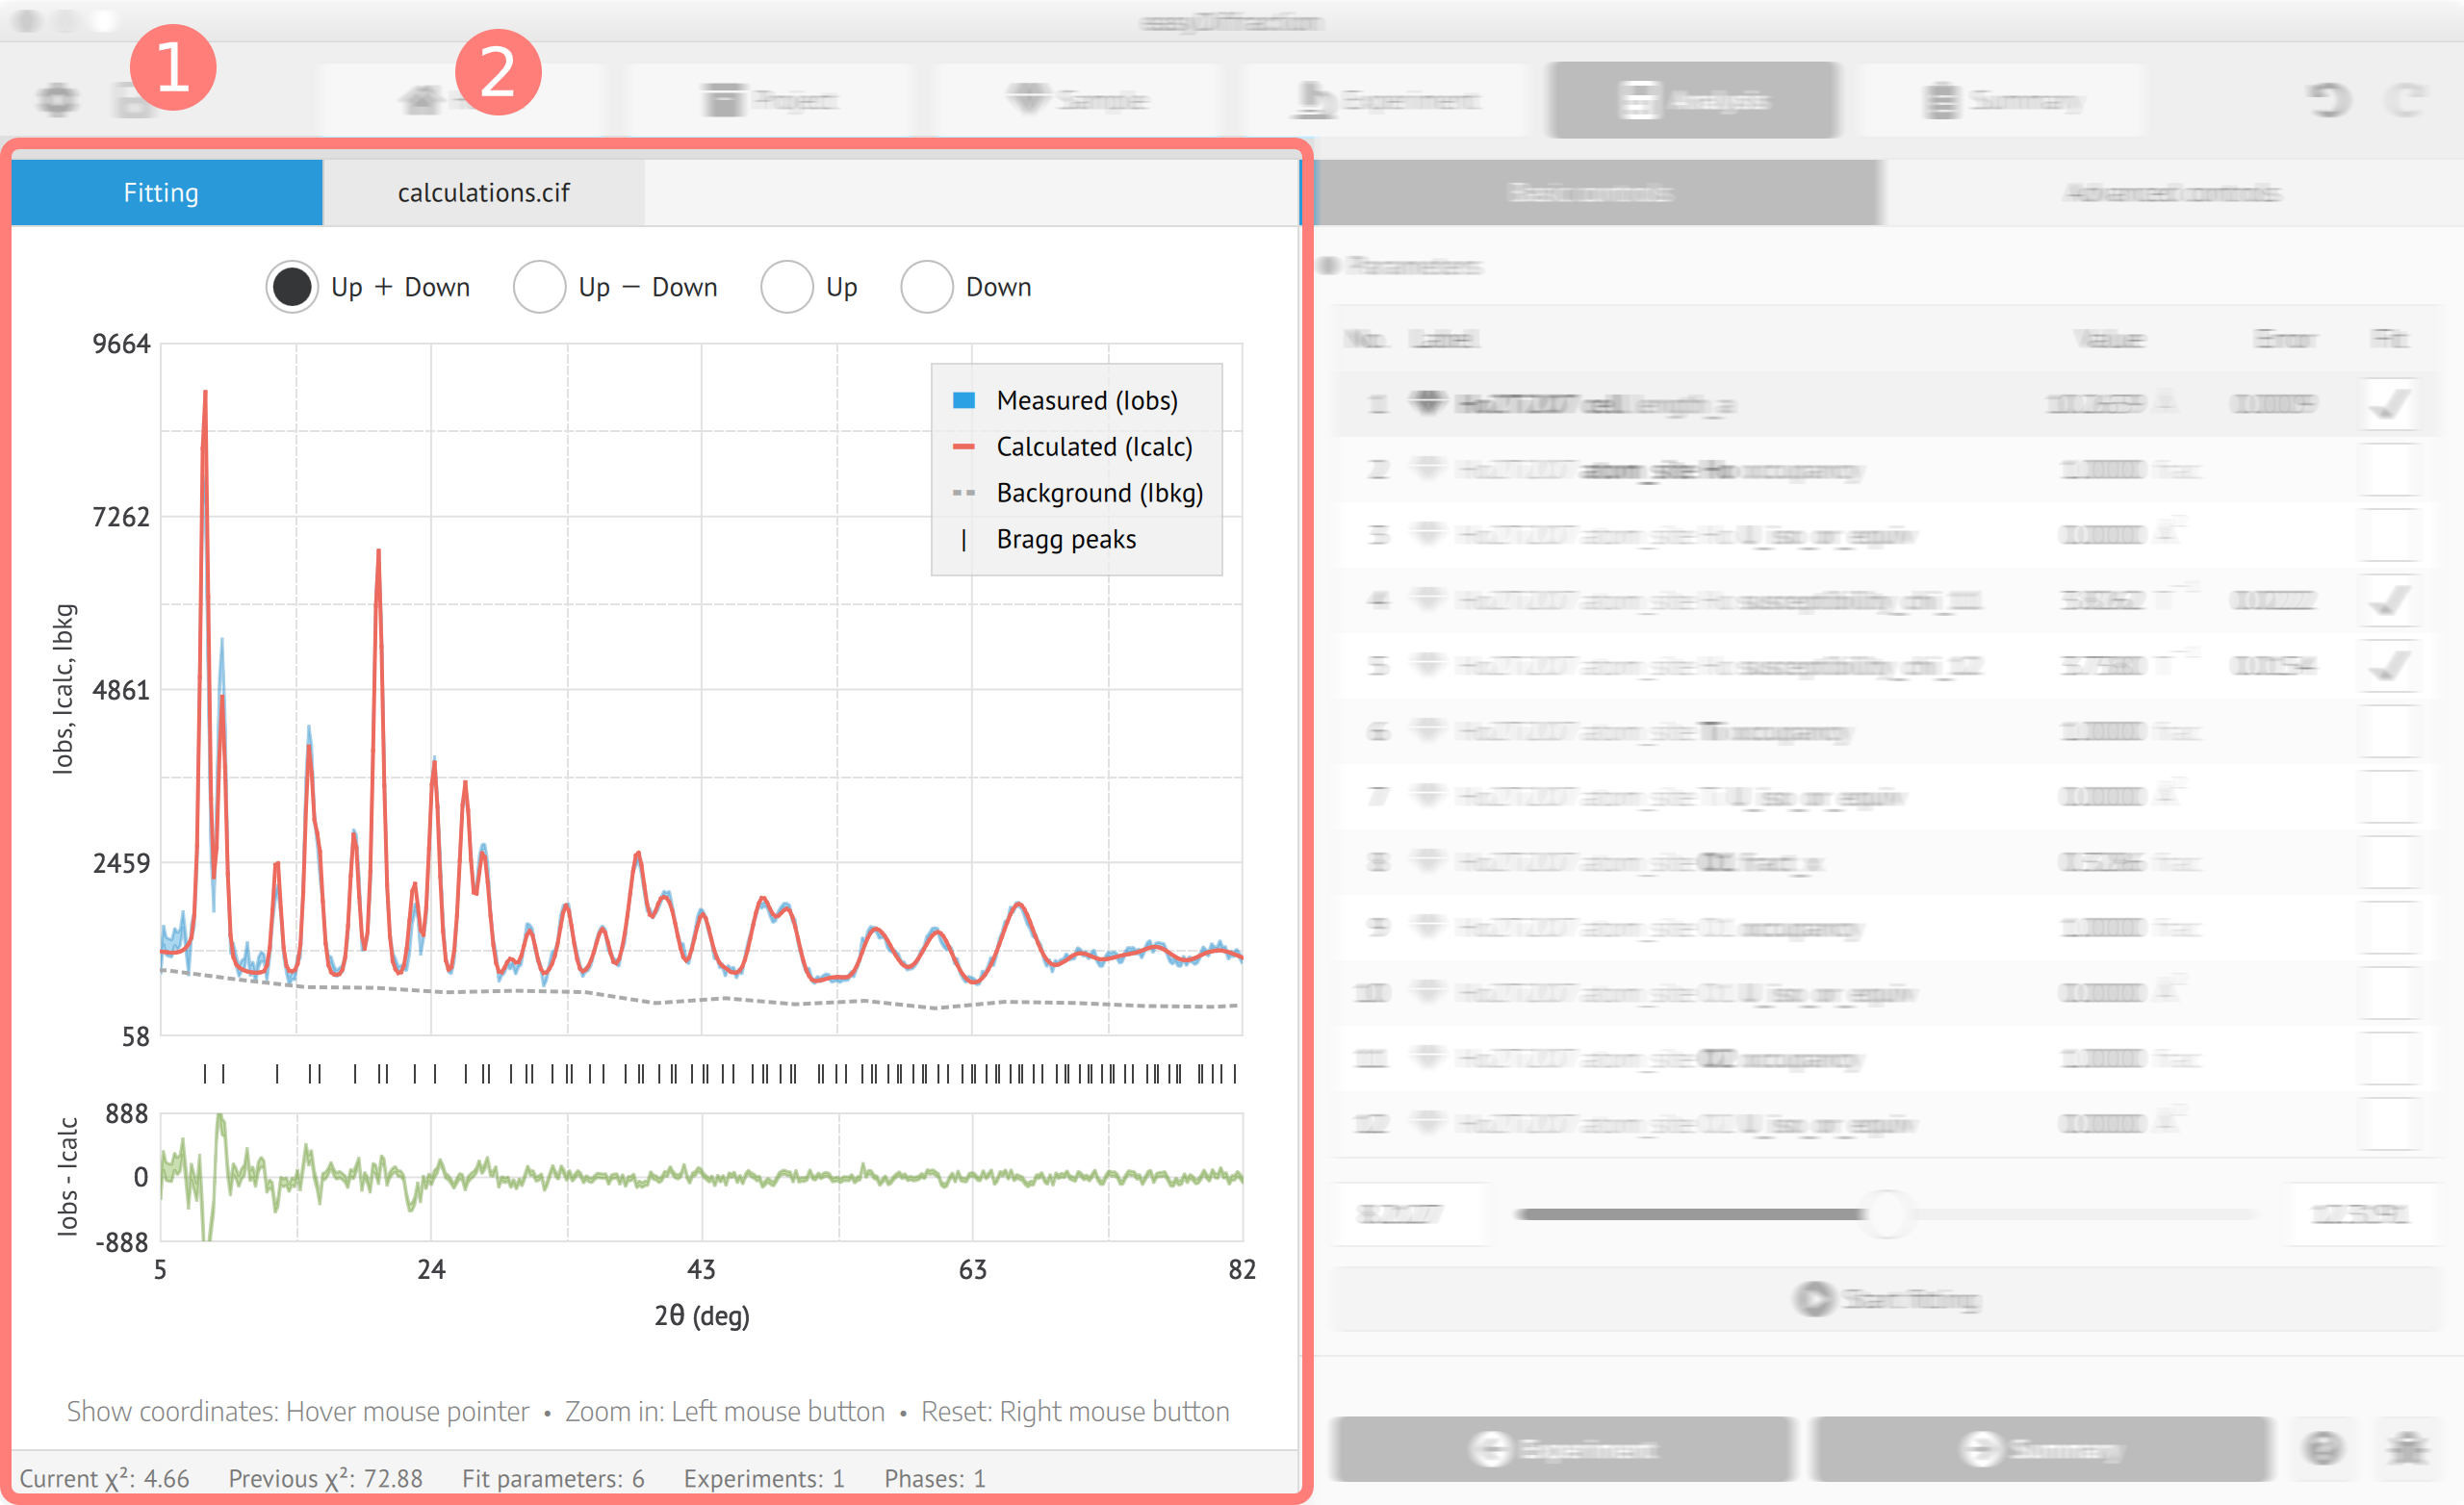
The Main Window of the program is located below the Toolbar and it can contain
several tabs depending on the current step in the data analysis workflow. An example of the Main Window for
the analysis step is shown in the figure below. You can switch between the Fitting and
Text View at any time clicking on the required tab.

3.1.3. Sidebar
The Sidebar is located at the right side of the application window, below the Toolbar. It has 2 tabs:
Basic controls and Advanced controls. Their contents depend on the selected tab in the
Toolbar and the respective tab in the Main Window. You can switch between them at any time clicking
on the required tab.
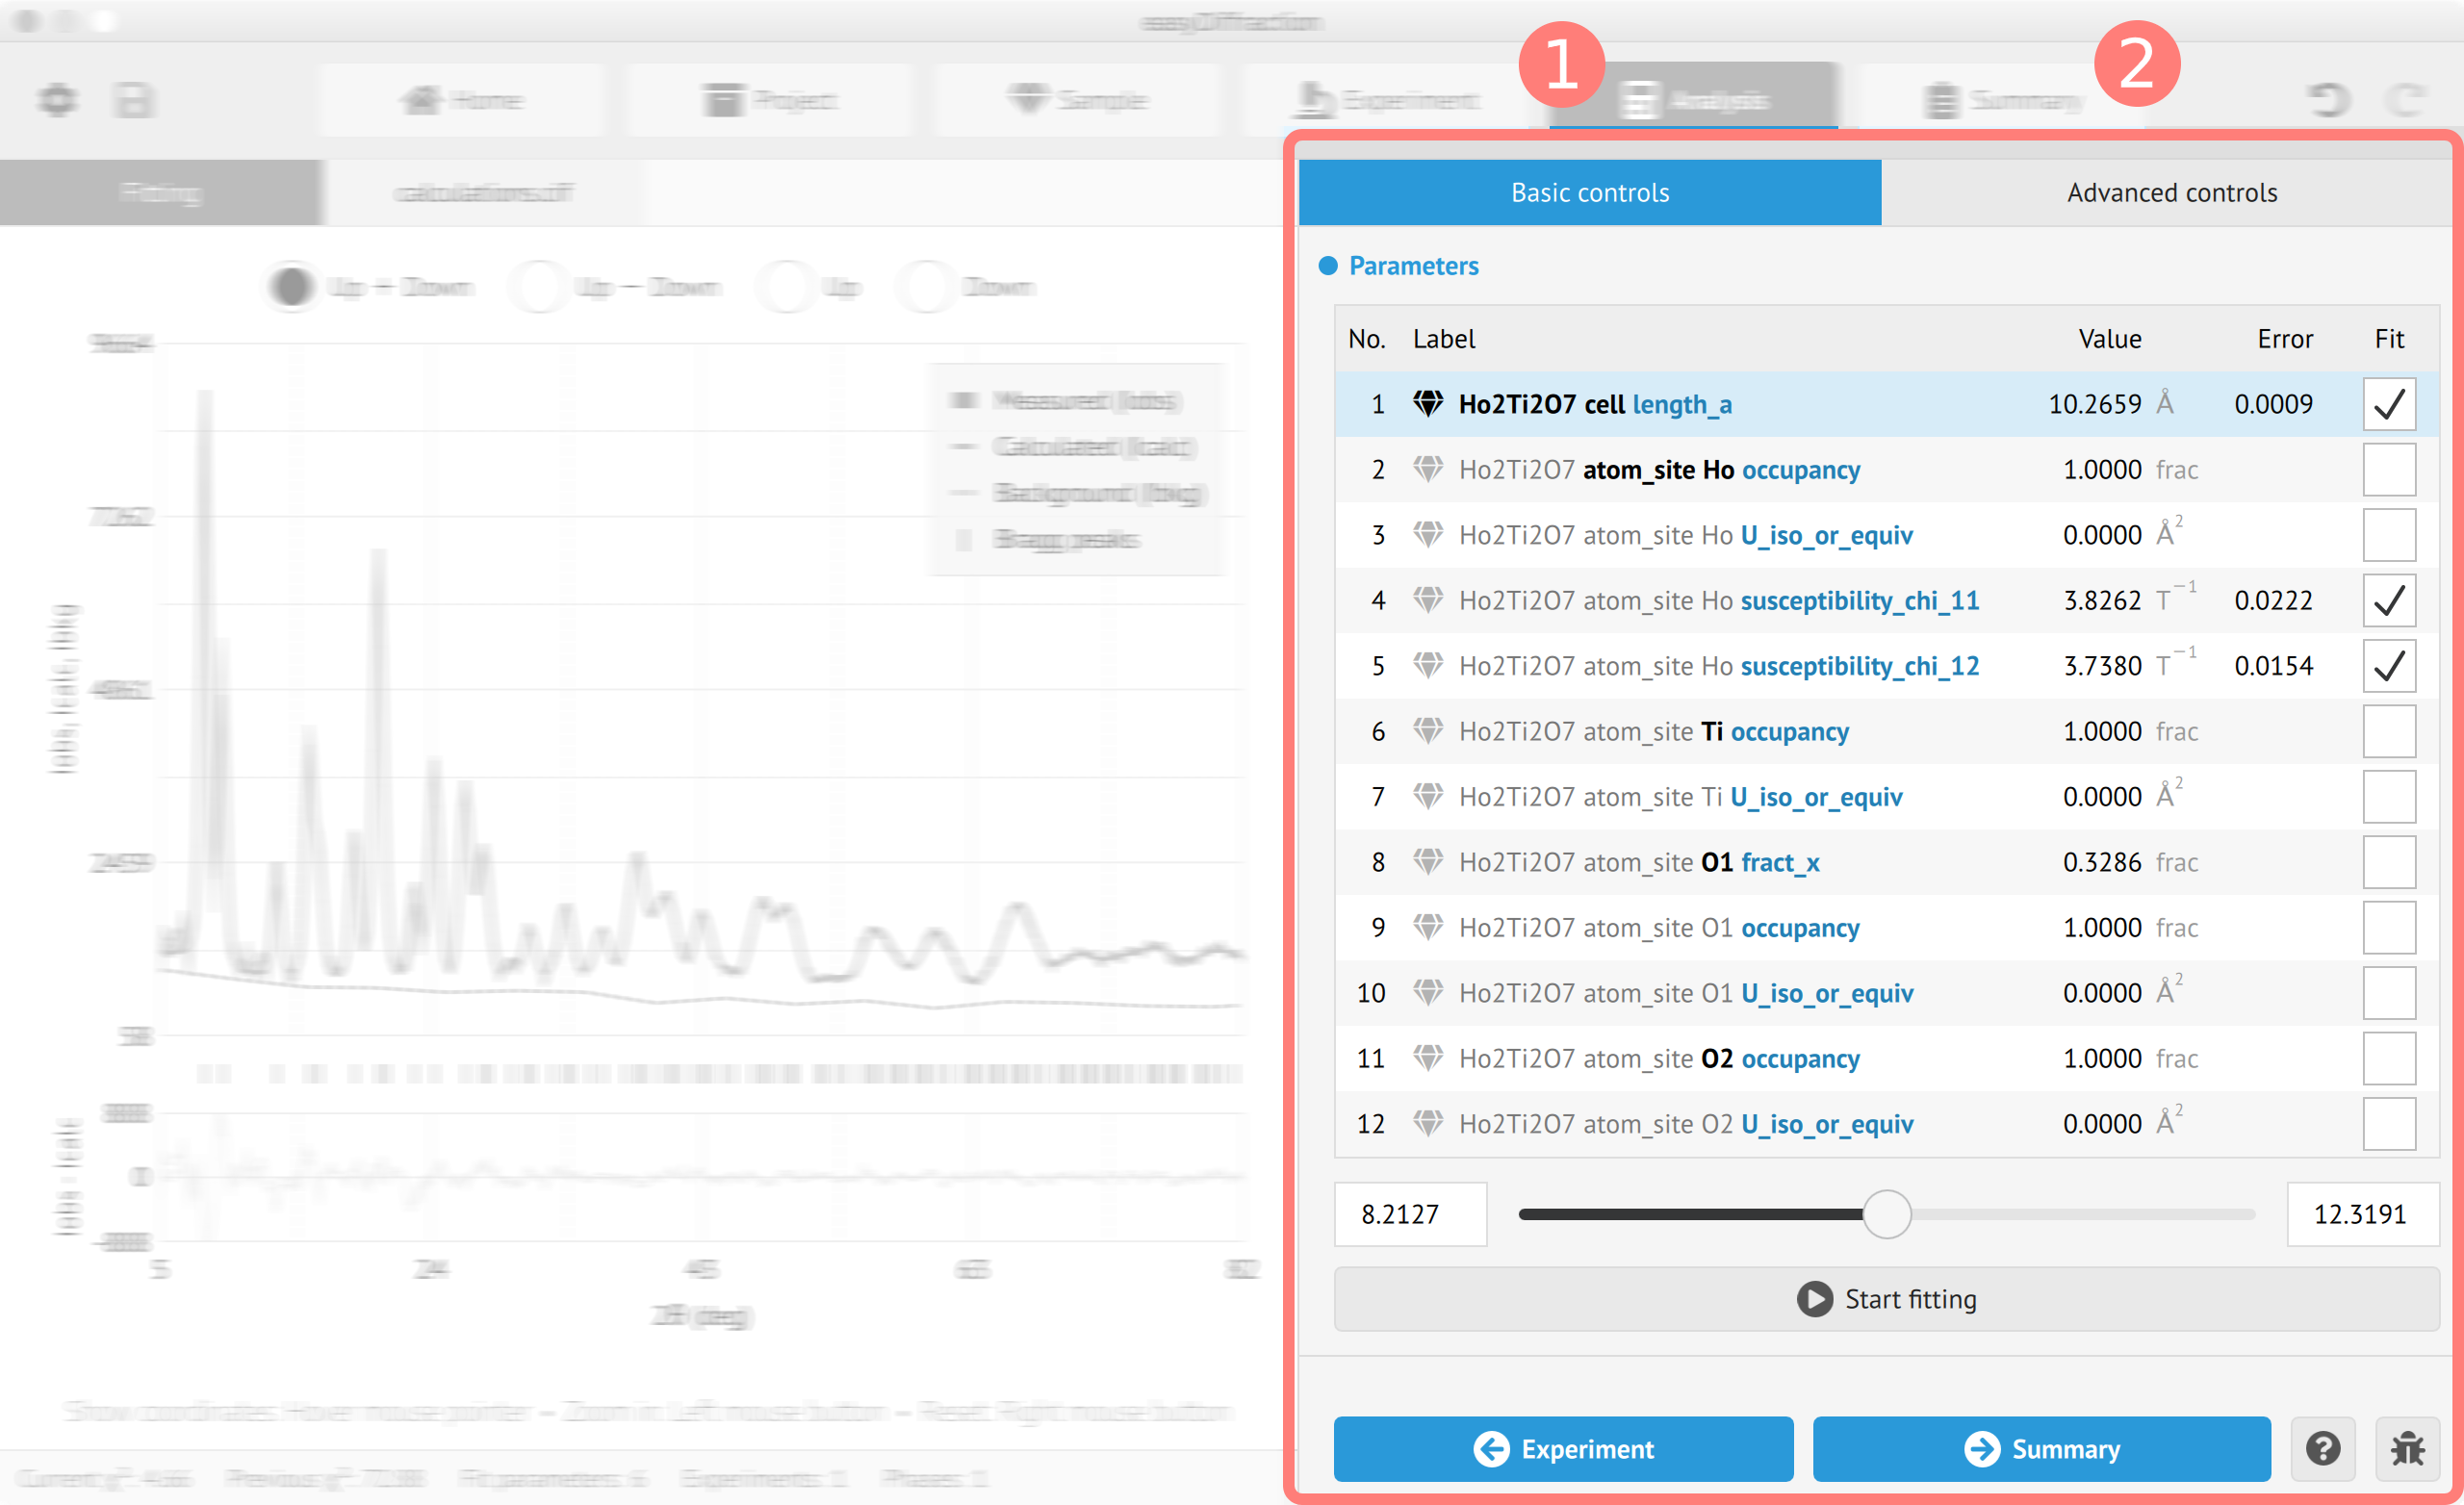

Basic controlstab provides an access to essential actions and information fields.Advanced controlstab describes additional actions recommended for advanced users.
The content of the Basic controls and Advanced controls tabs for every workflow step are described
in the sections below.
3.2. easyDiffraction project files
Input/output files are in simple and human-readable data format STAR/CIF with the specifications of International Union of Crystallography, where possible. Click here for more details.
The project consists of the following files:
project.cifwith project description.samples.cifdescribes sample phases.experiments.cifcontains instrumental parameters and experimentally measured data.calculations.cifis the output file with the calculation results.
3.2.1. Unpolarized diffraction
Example of .cif files for 1D unpolarized neutron powder diffraction data are given below:
project.cif
                    _name PbSO4

                    _keywords 'unpolarised neutron powder diffraction, D1A at ILL'

                    _samples samples.cif

                    _experiments experiments.cif

                    _calculations calculations.cif
samples.cif
                    data_PbSO4


                    _space_group_name_H-M_ref 'P n m a'

                    _space_group_IT_coordinate_system_code abc


                    _cell_length_a 8.477425(36)

                    _cell_length_b 5.395977(24)

                    _cell_length_c 6.957024(33)

                    _cell_angle_alpha 90.0

                    _cell_angle_beta  90.0

                    _cell_angle_gamma 90.0


                    loop_

                    _atom_site_label

                    _atom_site_type_symbol

                    _atom_site_fract_x

                    _atom_site_fract_y

                    _atom_site_fract_z

                    _atom_site_occupancy

                    _atom_site_adp_type

                    _atom_site_u_iso_or_equiv
Pb Pb  0.188 0.25  0.166  1.0  Uiso 0.01692
S  S   0.065
                    0.25  0.685  1.0  Uiso 0.00258
O1 O   0.908 0.25  0.595  1.0  Uiso 0.02469
O2 O   0.194
                    0.25  0.543  1.0  Uiso 0.01803
O3 O   0.081 0.027 0.808  1.0  Uiso 0.01655
experiments.cif
                    data_NPD


                    _setup_wavelength    1.912

                    _setup_offset_2theta 0.0()


                    _pd_instr_resolution_u  0.14207

                    _pd_instr_resolution_v -0.4181

                    _pd_instr_resolution_w  0.38629

                    _pd_instr_resolution_x  0.0

                    _pd_instr_resolution_y  0.09038


                    loop_

                    _phase_label

                    _phase_scale

                    _phase_igsize
PbSO4 1.0() 0.0


                    loop_

                    _pd_background_2theta

                    _pd_background_intensity
 11.0 205.6
 50.0 208.0
153.0 230.3


                    loop_

                    _pd_meas_2theta

                    _pd_meas_intensity

                    _pd_meas_intensity_sigma
10.05 214.0 15.0
10.10 219.0 15.0
10.15 224.0 15.0
10.20 198.0 14.0
10.25 229.0 15.0

                    ...
experiments.dat/experiments.xye (if experiments.cif is not available)
                    10.05 214.0 15.0

                    10.10 219.0 15.0

                    10.15 224.0 15.0

                    10.20 198.0 14.0

                    10.25 229.0 15.0

                    ...
3.2.2. Polarized diffraction
Example of .cif files for 1D polarized neutron powder diffraction data are given below:
project.cif
                    _name Fe3O4

                    _keywords 'polarised neutron powder diffraction, B = 5T, 6T2 at LLB'

                    _samples samples.cif

                    _experiments experiments.cif

                    _calculations calculations.cif
samples.cif
                    data_Fe3O4


                    _space_group_name_H-M_ref 'F d -3 m'

                    _space_group_IT_coordinate_system_code 2


                    _cell_length_a 8.57()

                    _cell_length_b 8.57

                    _cell_length_c 8.57

                    _cell_angle_alpha 90.0

                    _cell_angle_beta  90.0

                    _cell_angle_gamma 90.0


                    loop_

                    _atom_site_label

                    _atom_site_type_symbol

                    _atom_site_fract_x

                    _atom_site_fract_y

                    _atom_site_fract_z

                    _atom_site_occupancy

                    _atom_site_adp_type

                    _atom_site_u_iso_or_equiv
Fe3A Fe3+ 0.125 0.125 0.125  1.0  Uiso 0.0
Fe3B Fe3+ 0.5   0.5   0.5    1.0  Uiso
                    0.0
O    O2-  0.255 0.255 0.255  1.0  Uiso 0.0


                    loop_

                    _atom_site_susceptibility_label

                    _atom_site_susceptibility_chi_type

                    _atom_site_susceptibility_chi_11

                    _atom_site_susceptibility_chi_22

                    _atom_site_susceptibility_chi_33

                    _atom_site_susceptibility_chi_12

                    _atom_site_susceptibility_chi_13

                    _atom_site_susceptibility_chi_23
Fe3A Cani -0.0860() -0.0860 -0.0860 0.0 0.0 0.0
Fe3B Cani  0.0784()  0.0784  0.0784 0.0 0.0 0.0


                    loop_

                    _atom_site_scat_label

                    _atom_site_scat_lande

                    _atom_site_scat_kappa
Fe3A 2.0 1.0
Fe3B 2.0 1.0
experiments.cif
                    data_PolNPD5T


                    _setup_wavelength 2.4

                    _setup_field 5.0

                    _setup_offset_2theta -0.36


                    _pd_instr_resolution_u  11.34

                    _pd_instr_resolution_v -2.983

                    _pd_instr_resolution_w  1.141

                    _pd_instr_resolution_x  0.0

                    _pd_instr_resolution_y  0.404


                    _diffrn_radiation_polarization 0.6243

                    _diffrn_radiation_efficiency   1.0


                    _chi2_sum  True

                    _chi2_diff True

                    _chi2_up   False

                    _chi2_down False


                    loop_

                    _phase_label

                    _phase_scale

                    _phase_igsize
Fe3O4 0.162() 0.0


                    loop_

                    _pd_background_2theta

                    _pd_background_intensity
10.0 183.0
40.0 258.1
72.0 361.0


                    loop_

                    _pd_meas_2theta

                    _pd_meas_intensity_up

                    _pd_meas_intensity_up_sigma

                    _pd_meas_intensity_down

                    _pd_meas_intensity_down_sigma
10.0 180.31 28.49 184.69 28.47
10.2 182.67 26.88 176.10 26.86
10.4 192.40 26.33 160.49 26.28
10.6 186.10 25.81
                    179.53 25.84
10.8 202.31 24.48 197.54 24.41
11.0 194.79 24.02 180.75 23.98

                    ...
experiments.dat/experiments.xye (if experiments.cif is not available)
                    10.0 180.31 28.49 184.69 28.47
10.2 182.67 26.88 176.10 26.86
10.4 192.40 26.33 160.49 26.28
10.6 186.10 25.81
                    179.53 25.84
10.8 202.31 24.48 197.54 24.41
11.0 194.79 24.02 180.75 23.98

                    ...
3.3. Data analysis workflow
This section describes all the steps in the data processing with easyDiffraction, starting from the loading of input data files and ending with saving the calculated parameters.
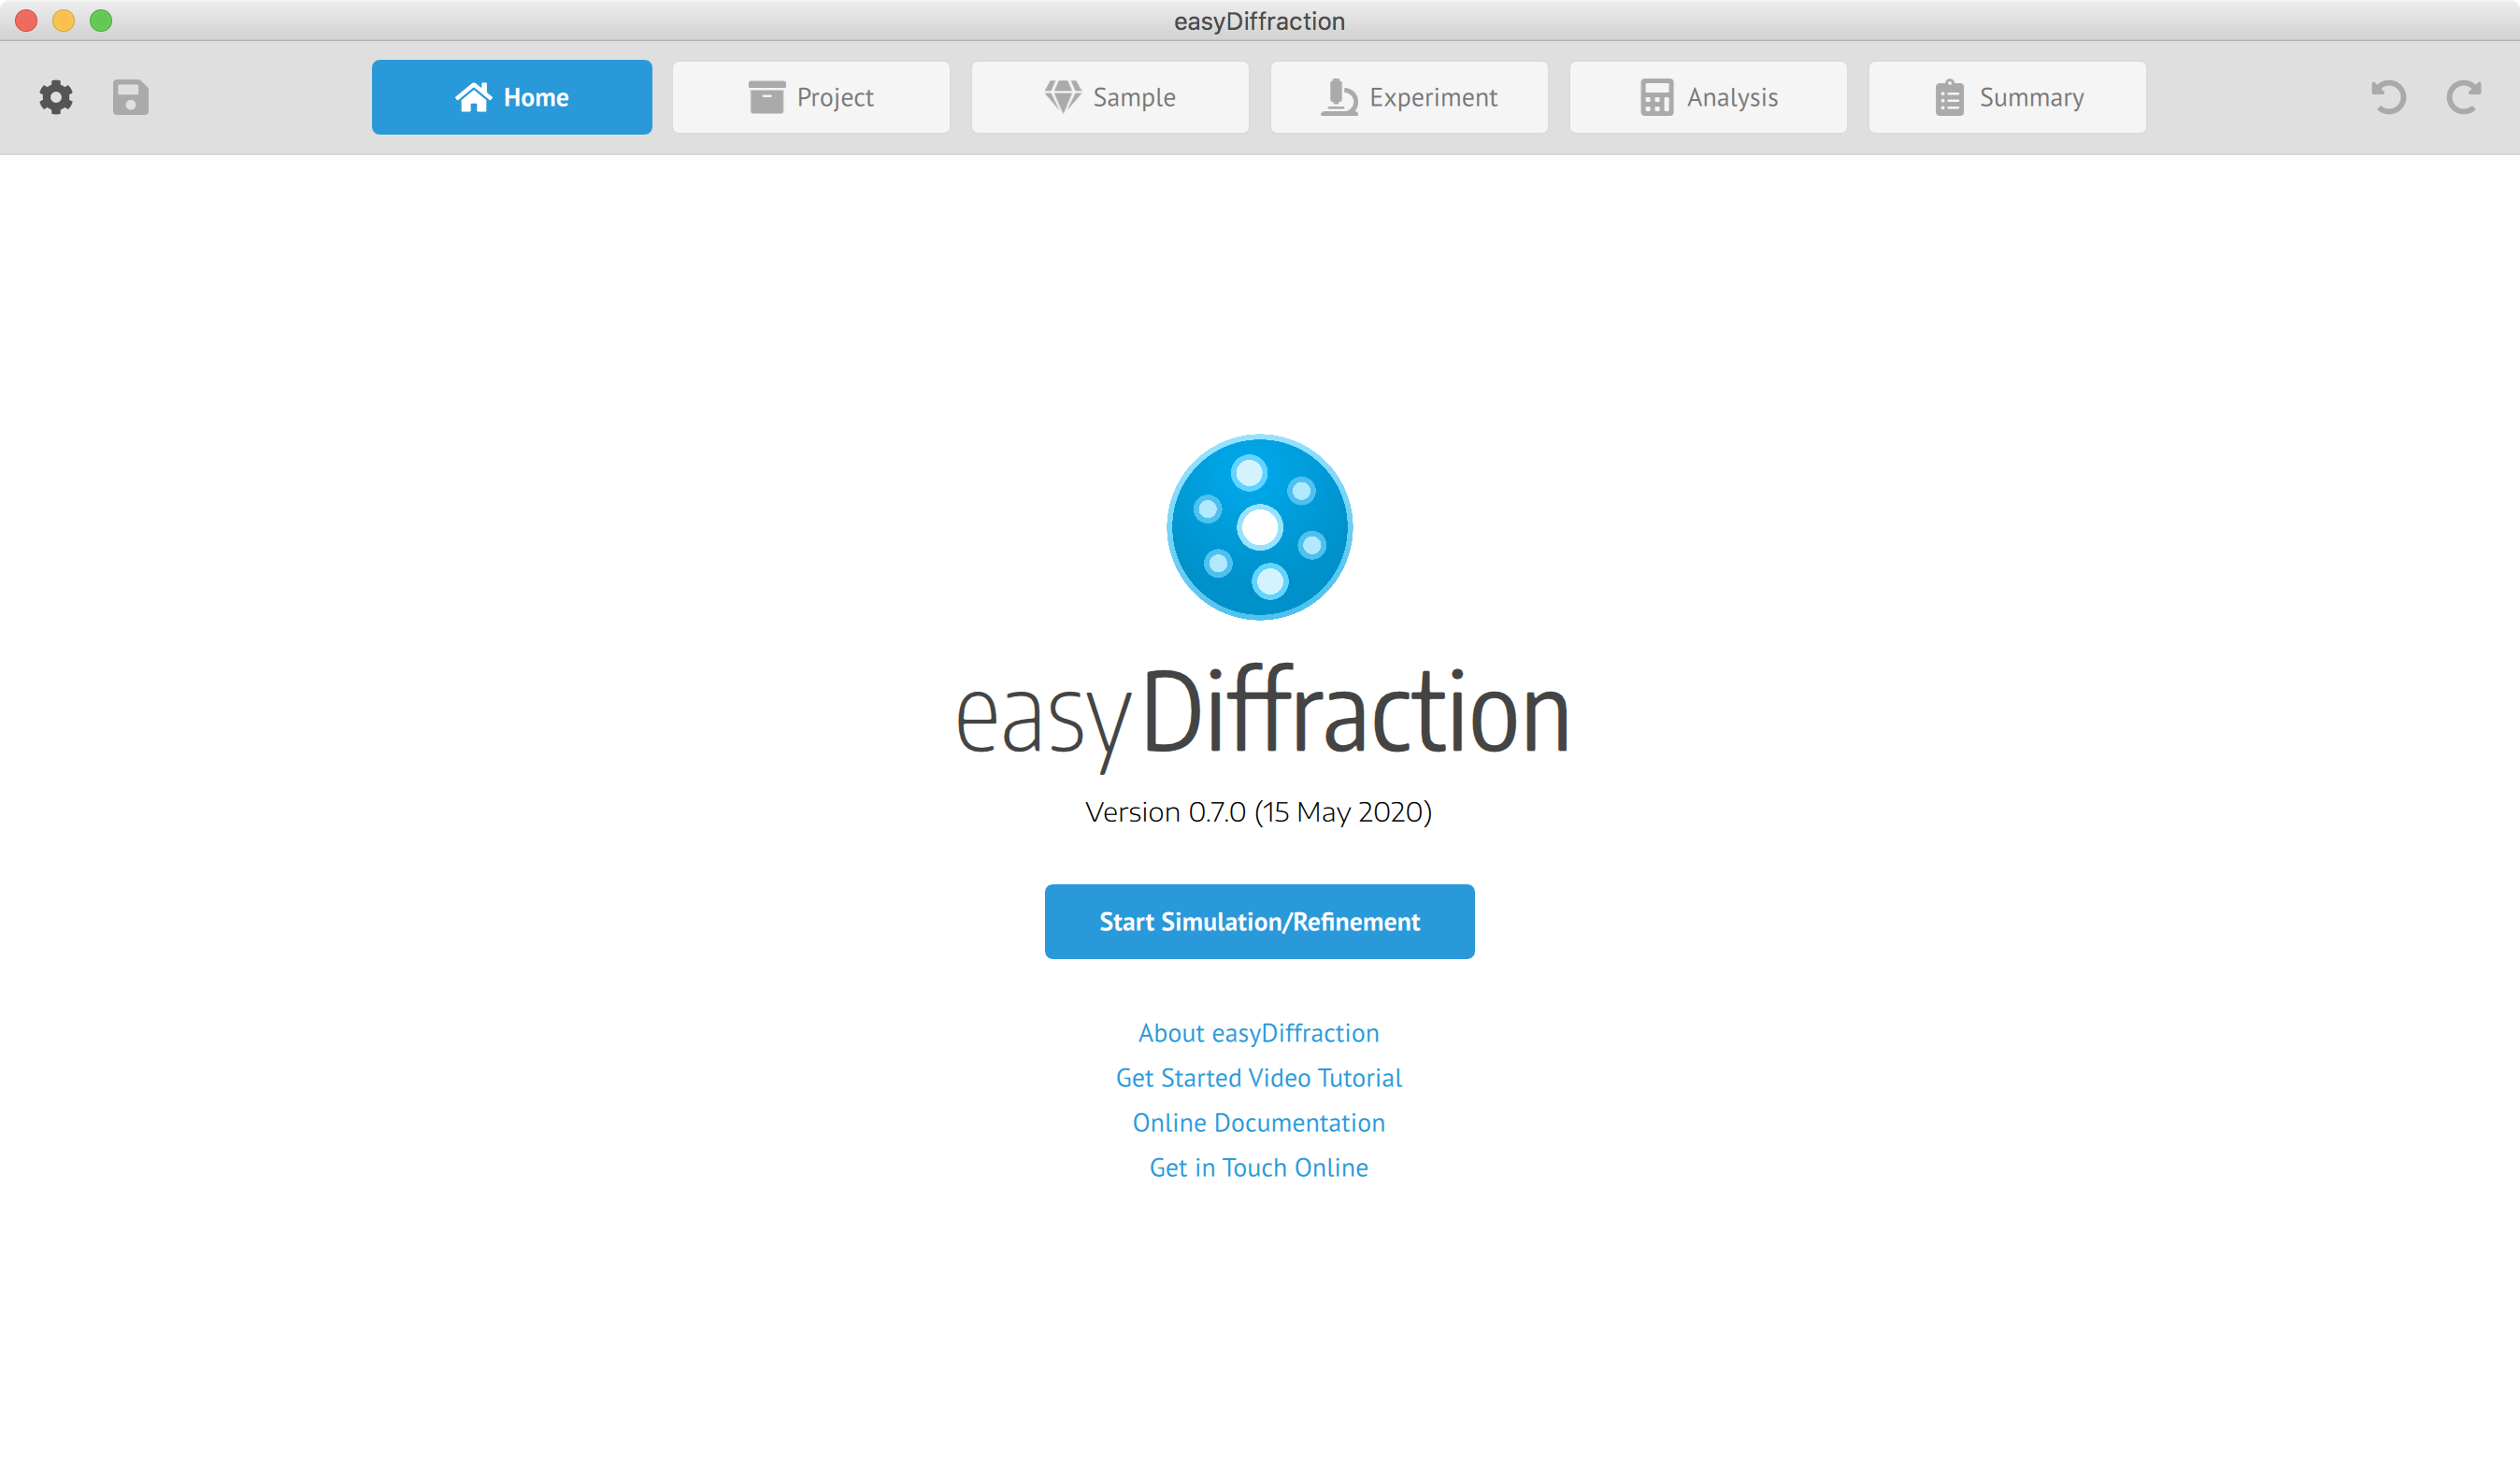
3.3.1. Home page
Choose to read about the project, get help or start data analysis with easyDiffraction, see the screenshot below:

3.3.2. Create/Open project
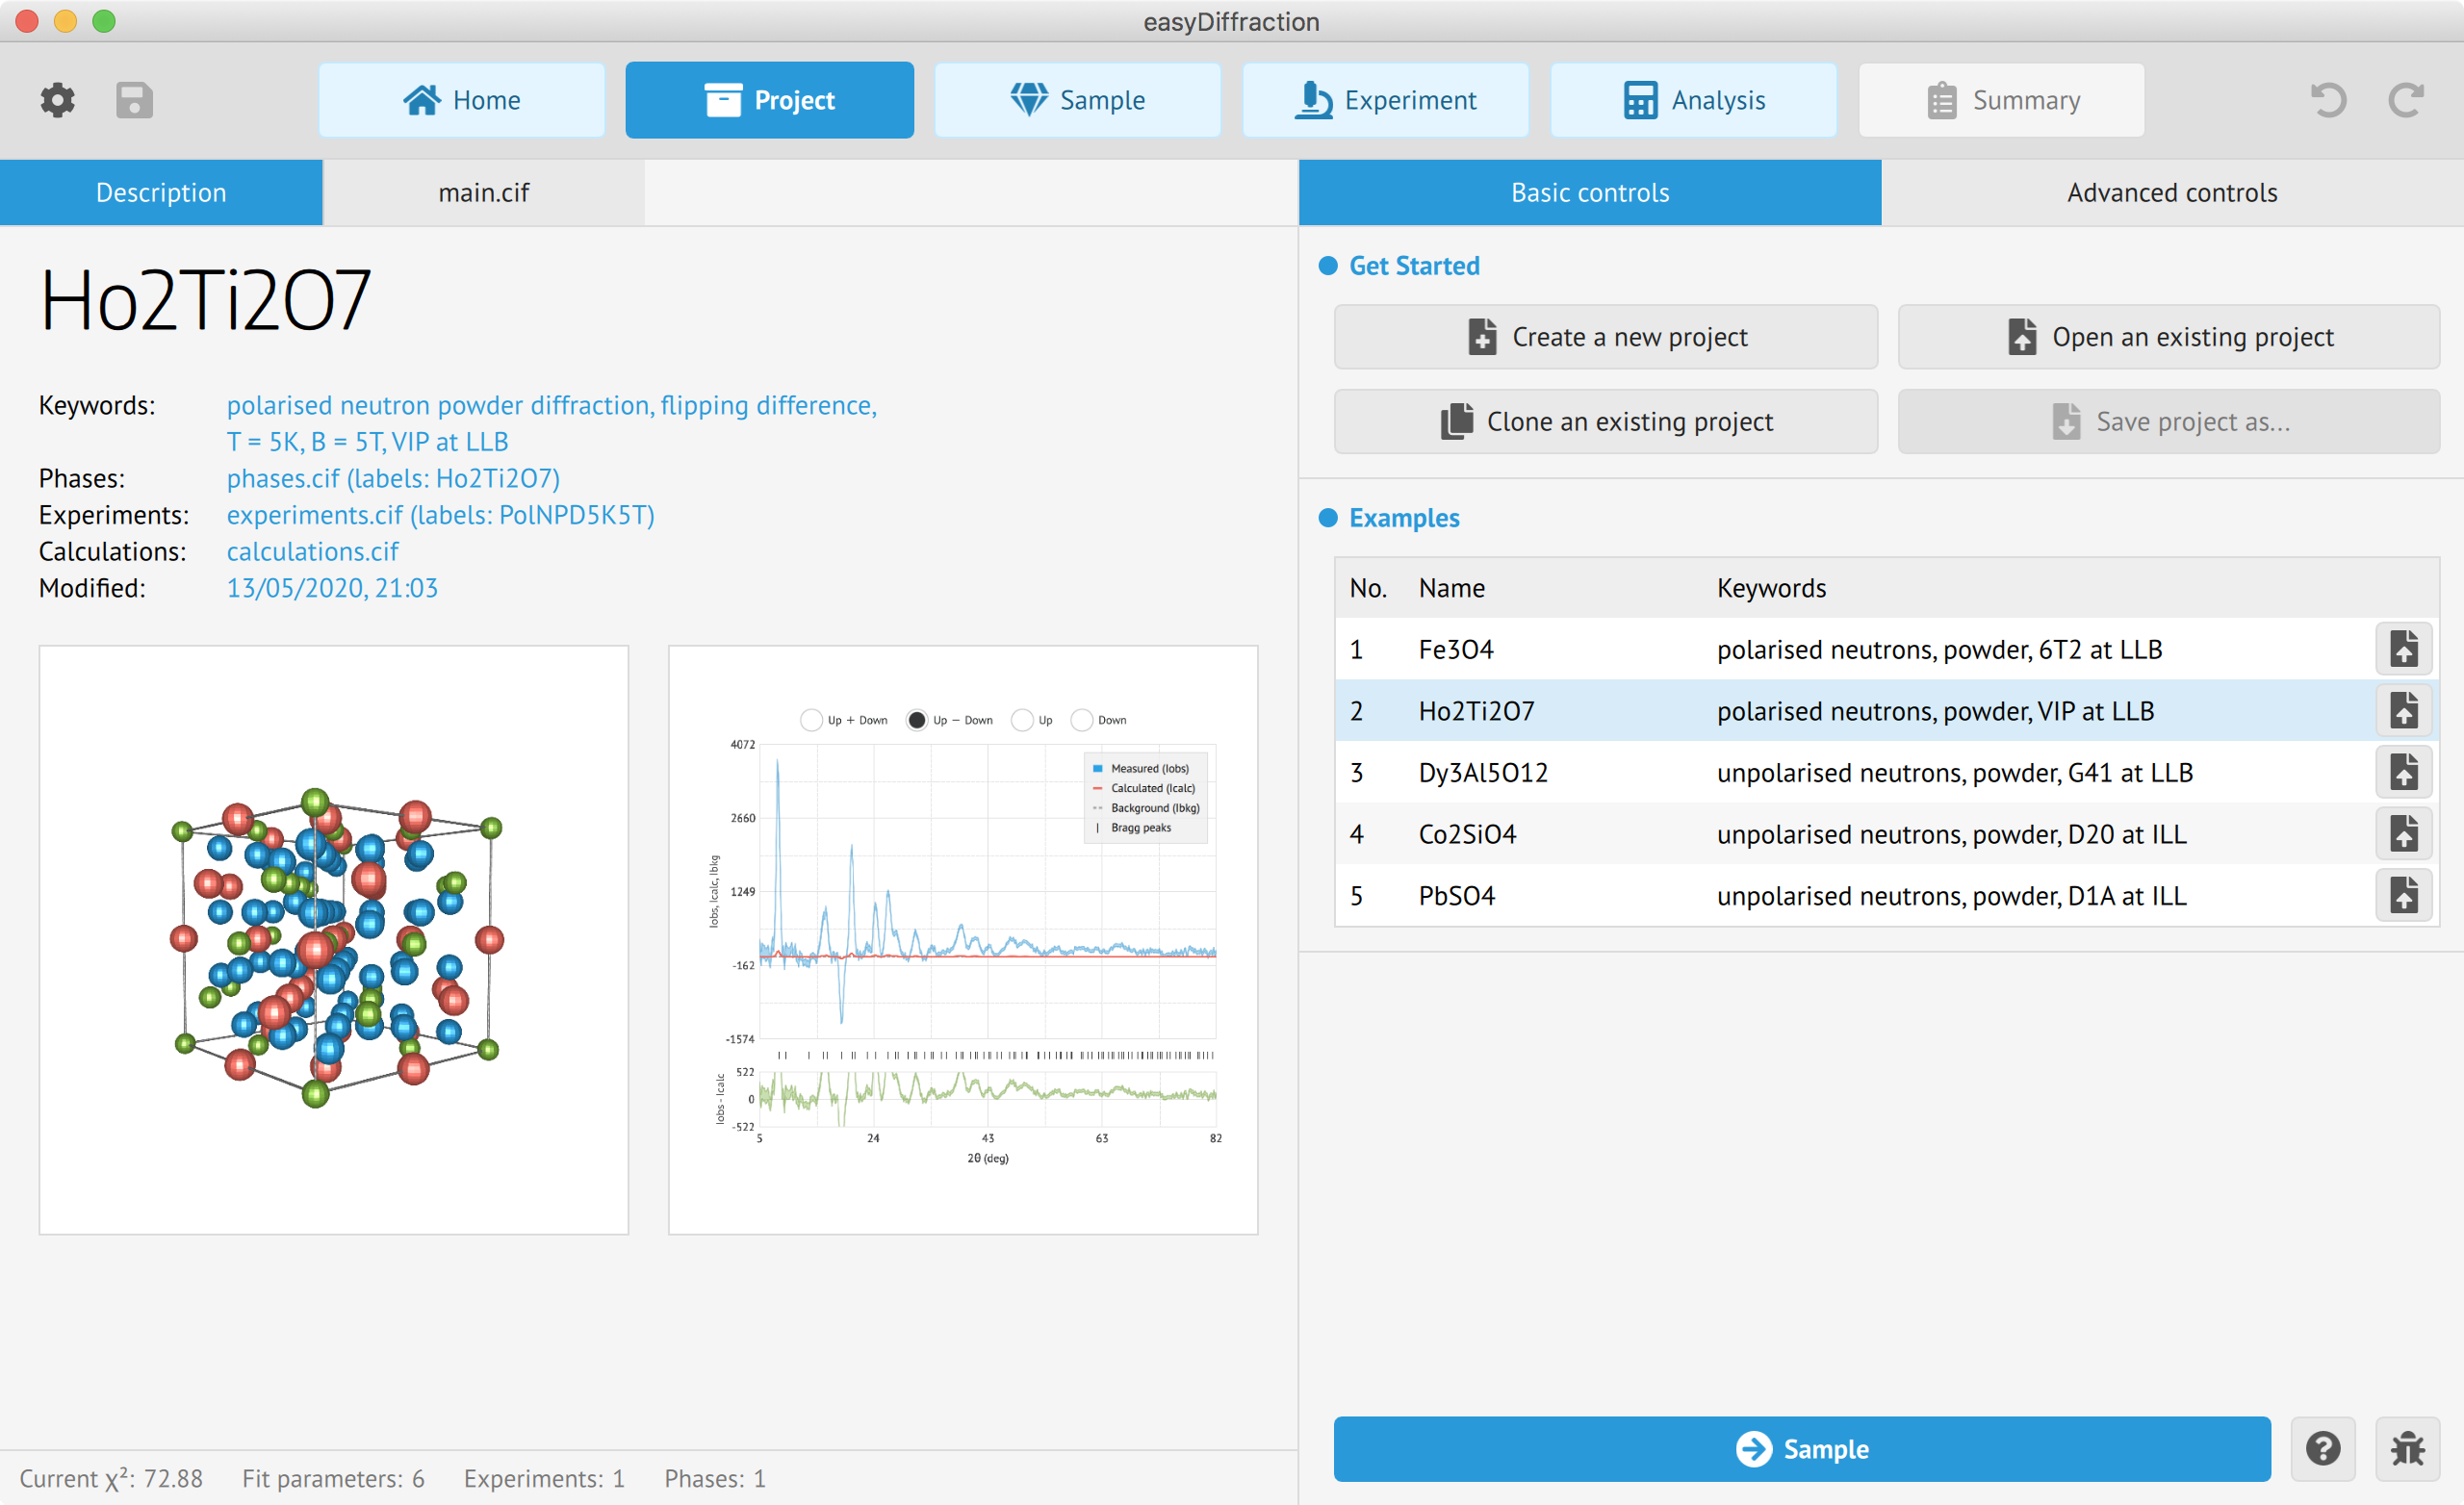
All manipulations of the project can be performed on the Project tab.
To start using easyDiffraction, please click the Create a new project
button to start a new project, or click the Open an existing project button and select zipped
project saved earlier or main.cif file from the existing project folder. Alternatively, you can
load one of the provided examples by clicking Open button in the Examples table.

Application main window
The application's main window shows:
- Project name.
- Project related information (Keywords, Phases labels, etc.).
- Figures of the crystal structure and refinement curves.
Application sidebar
The application's sidebar contains the following groups:
- Get Started group contains buttons to create, open, clone (currently disabled) or save the project.
- Examples group contains a few selected examples.
The very bottom of the sidebar contains the following buttons:
Sampleto go to the next step in the data processing.Get Online Helpfor the current tab.Report a bug or issueonline.
Application main window
The application's main window contains the following tabs:
Structure Viewshows a 3D crystal structure model.Text Viewdisplays the structure model in the CIF format.
An interaction with the plot is performed as follows:
- Rotate structure: Drag with right mouse button pressed.
- Zoom in/out: Scroll using mouse wheel.
- Reset zoom and rotation: Click left mouse button.
Application sidebar
The application's sidebar contains the following groups:
- Structural phases group shows the table of crystalline phases present in the sample. The parameters of the selected phase are given in the groups below.
- Symmetry and cell parameters group contains information about space group crystal system, number, name and setting, as well as unit cell lengths and angles.
- Atoms, atomic coordinates and occupations group contains details about the atom sites, such as label, color in the structure plot, coordinates and occupancy.
- Atomic displacement parameters, also known as atomic vibration parameters or thermal parameters, are presented here.
- Magnetic susceptibility parameters, or atomic site susceptibility tensor within local susceptibility approach, are given here.
The very bottom of the sidebar contains the following buttons (it may be necessary to close some groups to view these):
Projectto go to the previous step in the data processing.Experimentto go to the next step in the data processing.Get Online Helpfor the current tab.Report a bug or issueonline.
3.3.4. Load experimental data
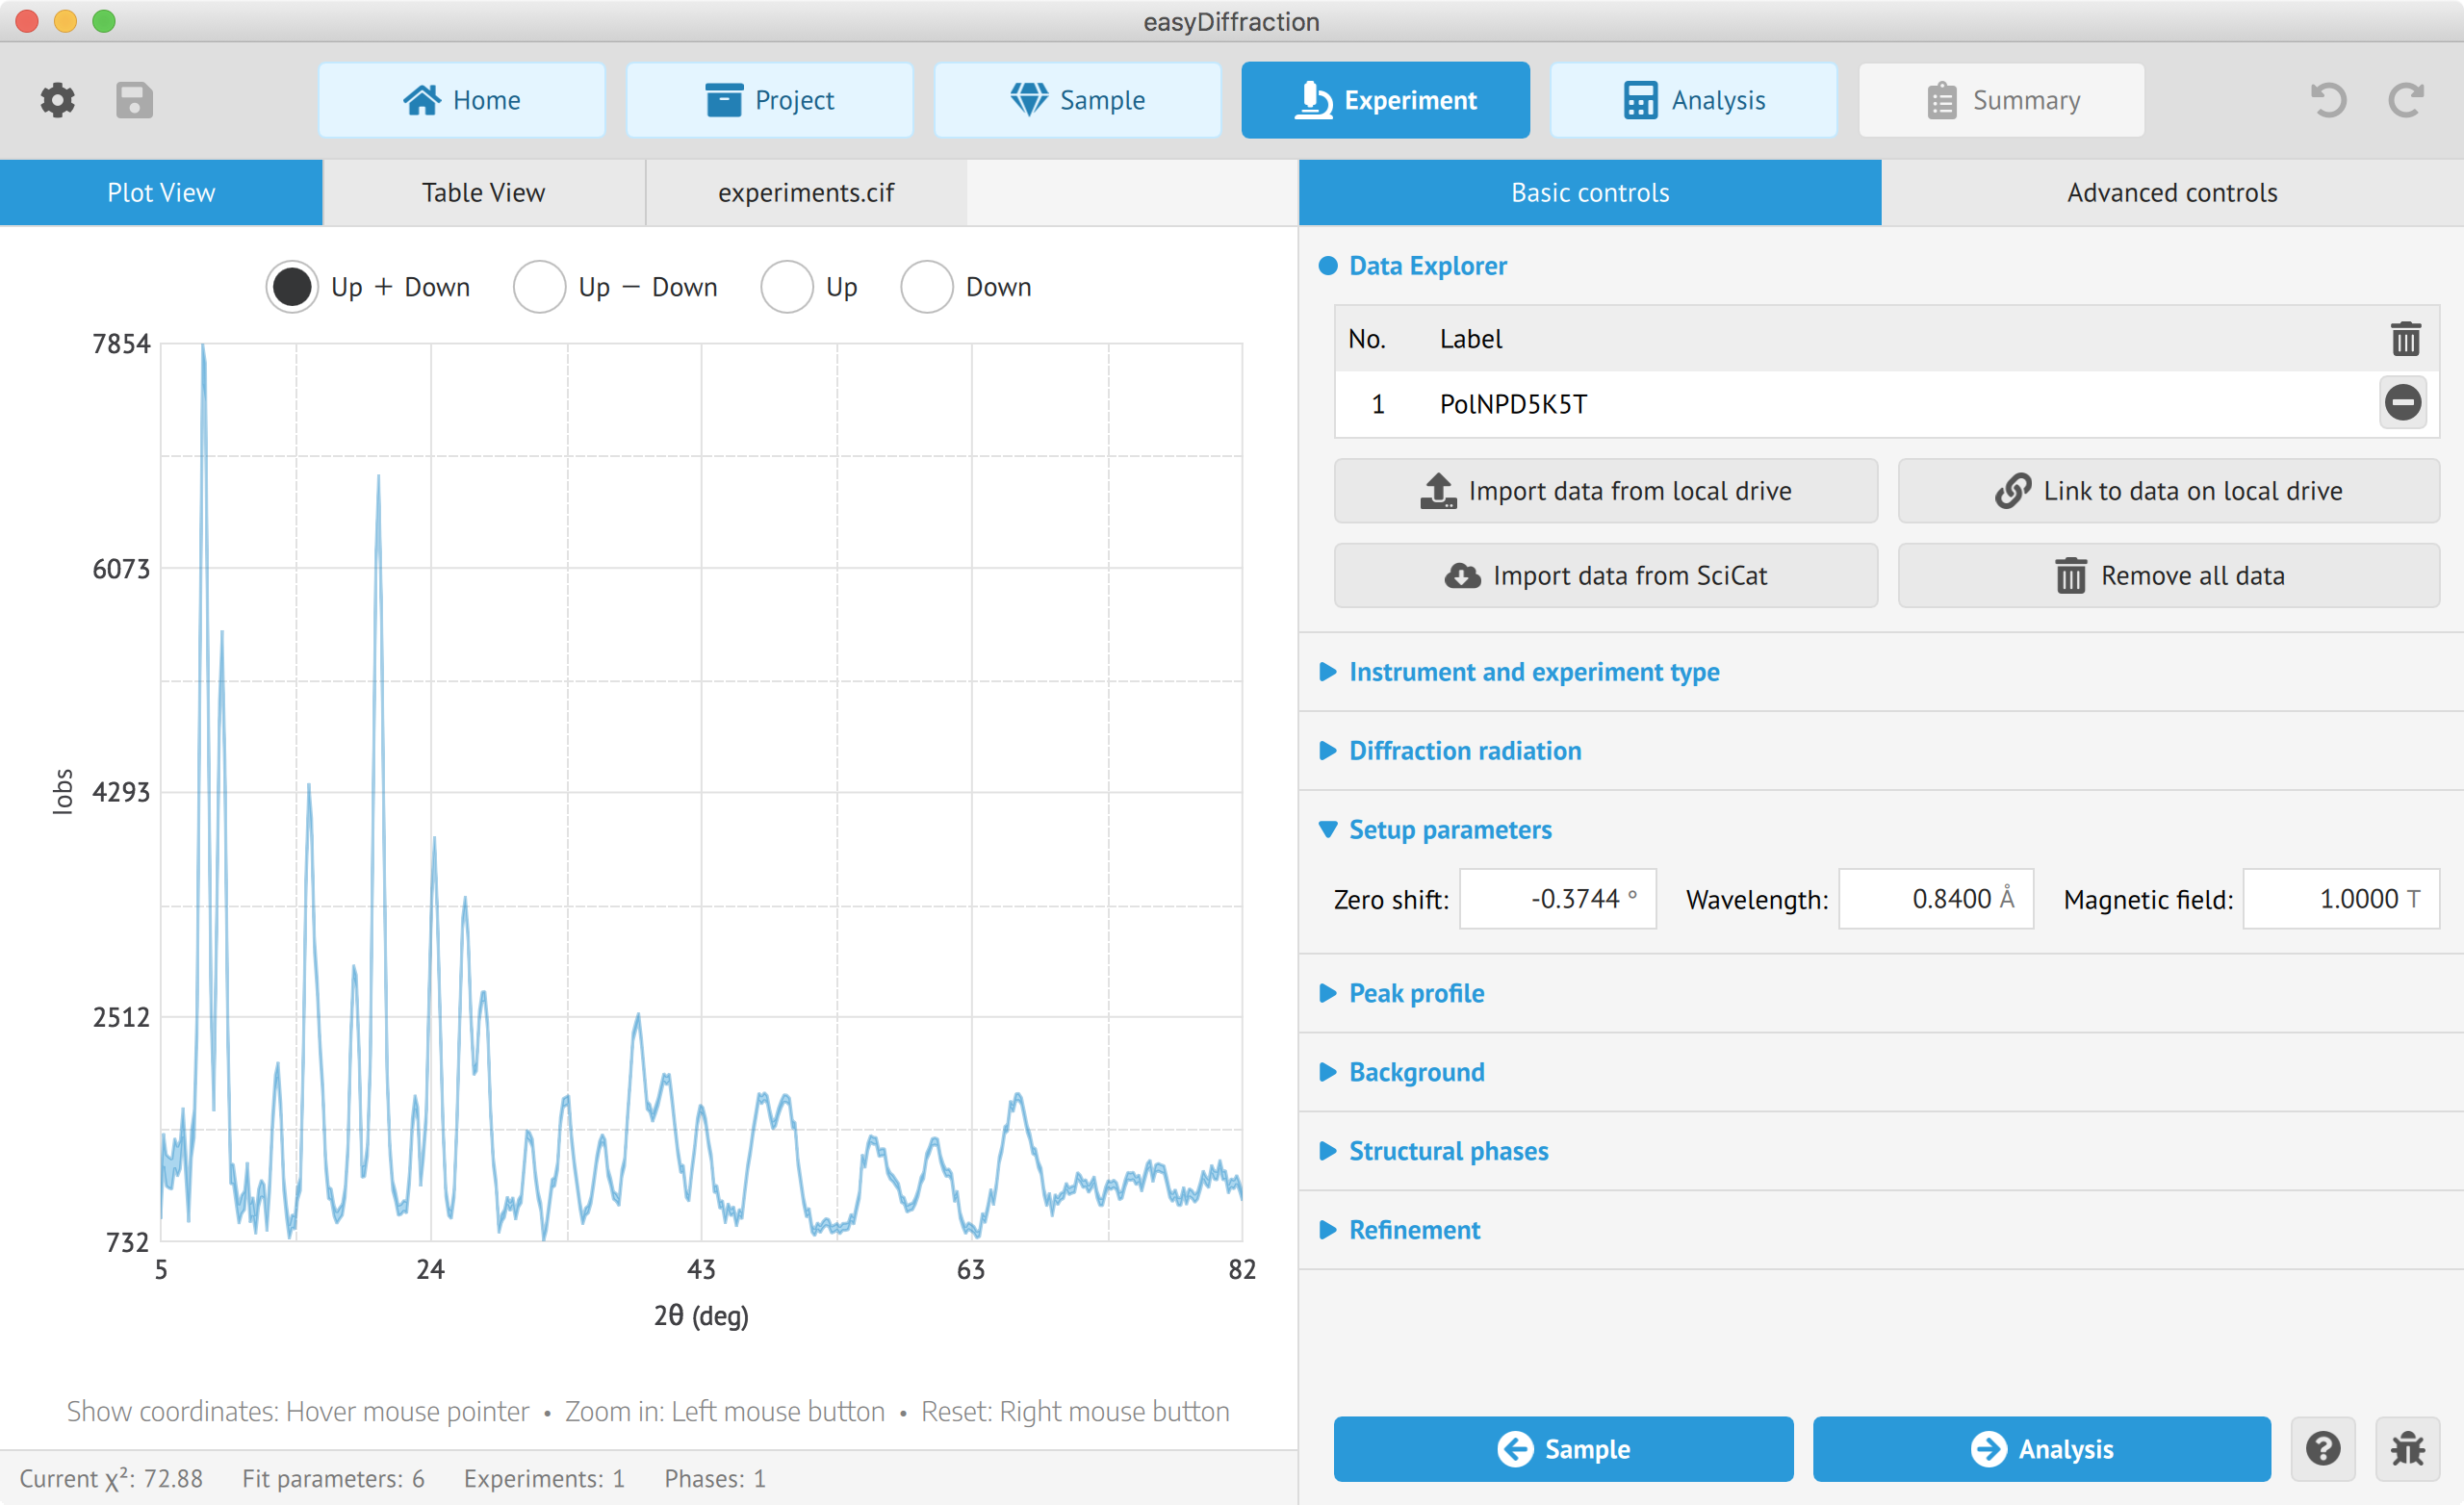
All manipulations with experimentally measured data can be performed on the
Experiment tab.

Application main window
The application's main window contains the following tabs:
Plot Viewshows the experimental data plots.Table Viewcontains a table with the extracted data.Text Viewdisplays the content of the data file.
An interaction with the plot is performed as follows:
- Show coordinates: Hover mouse pointer over the data point.
- Zoom in: Drag with left mouse button pressed.
- Reset zoom: Click right mouse button.
Application sidebar
The application's sidebar contains the following groups:
- Data explorer shows experimental data file and contains button for loading data.
- Instrument and experiment type contains information about the neutron scattering instrument.
- Diffraction radiation contains polarization and polarising efficiency for polarized neutron data.
- Setup parameters contains experimental zero shift, wavelength and magnetic field.
- Peak profile contains information about the peak profile.
- Peak profile contains background points.
- Structural phases contains name and scale of the associated phase.
- Refinement contains type of refinement for polarized neutron data.
The very bottom of the sidebar contains the following buttons:
Sampleto go to the previous step in the data processing.Analysisto go to the next step in the data processing.Get Online Helpfor the current tab.Report a bug or issueonline.
Application main window
The application's main window contains the following tabs:
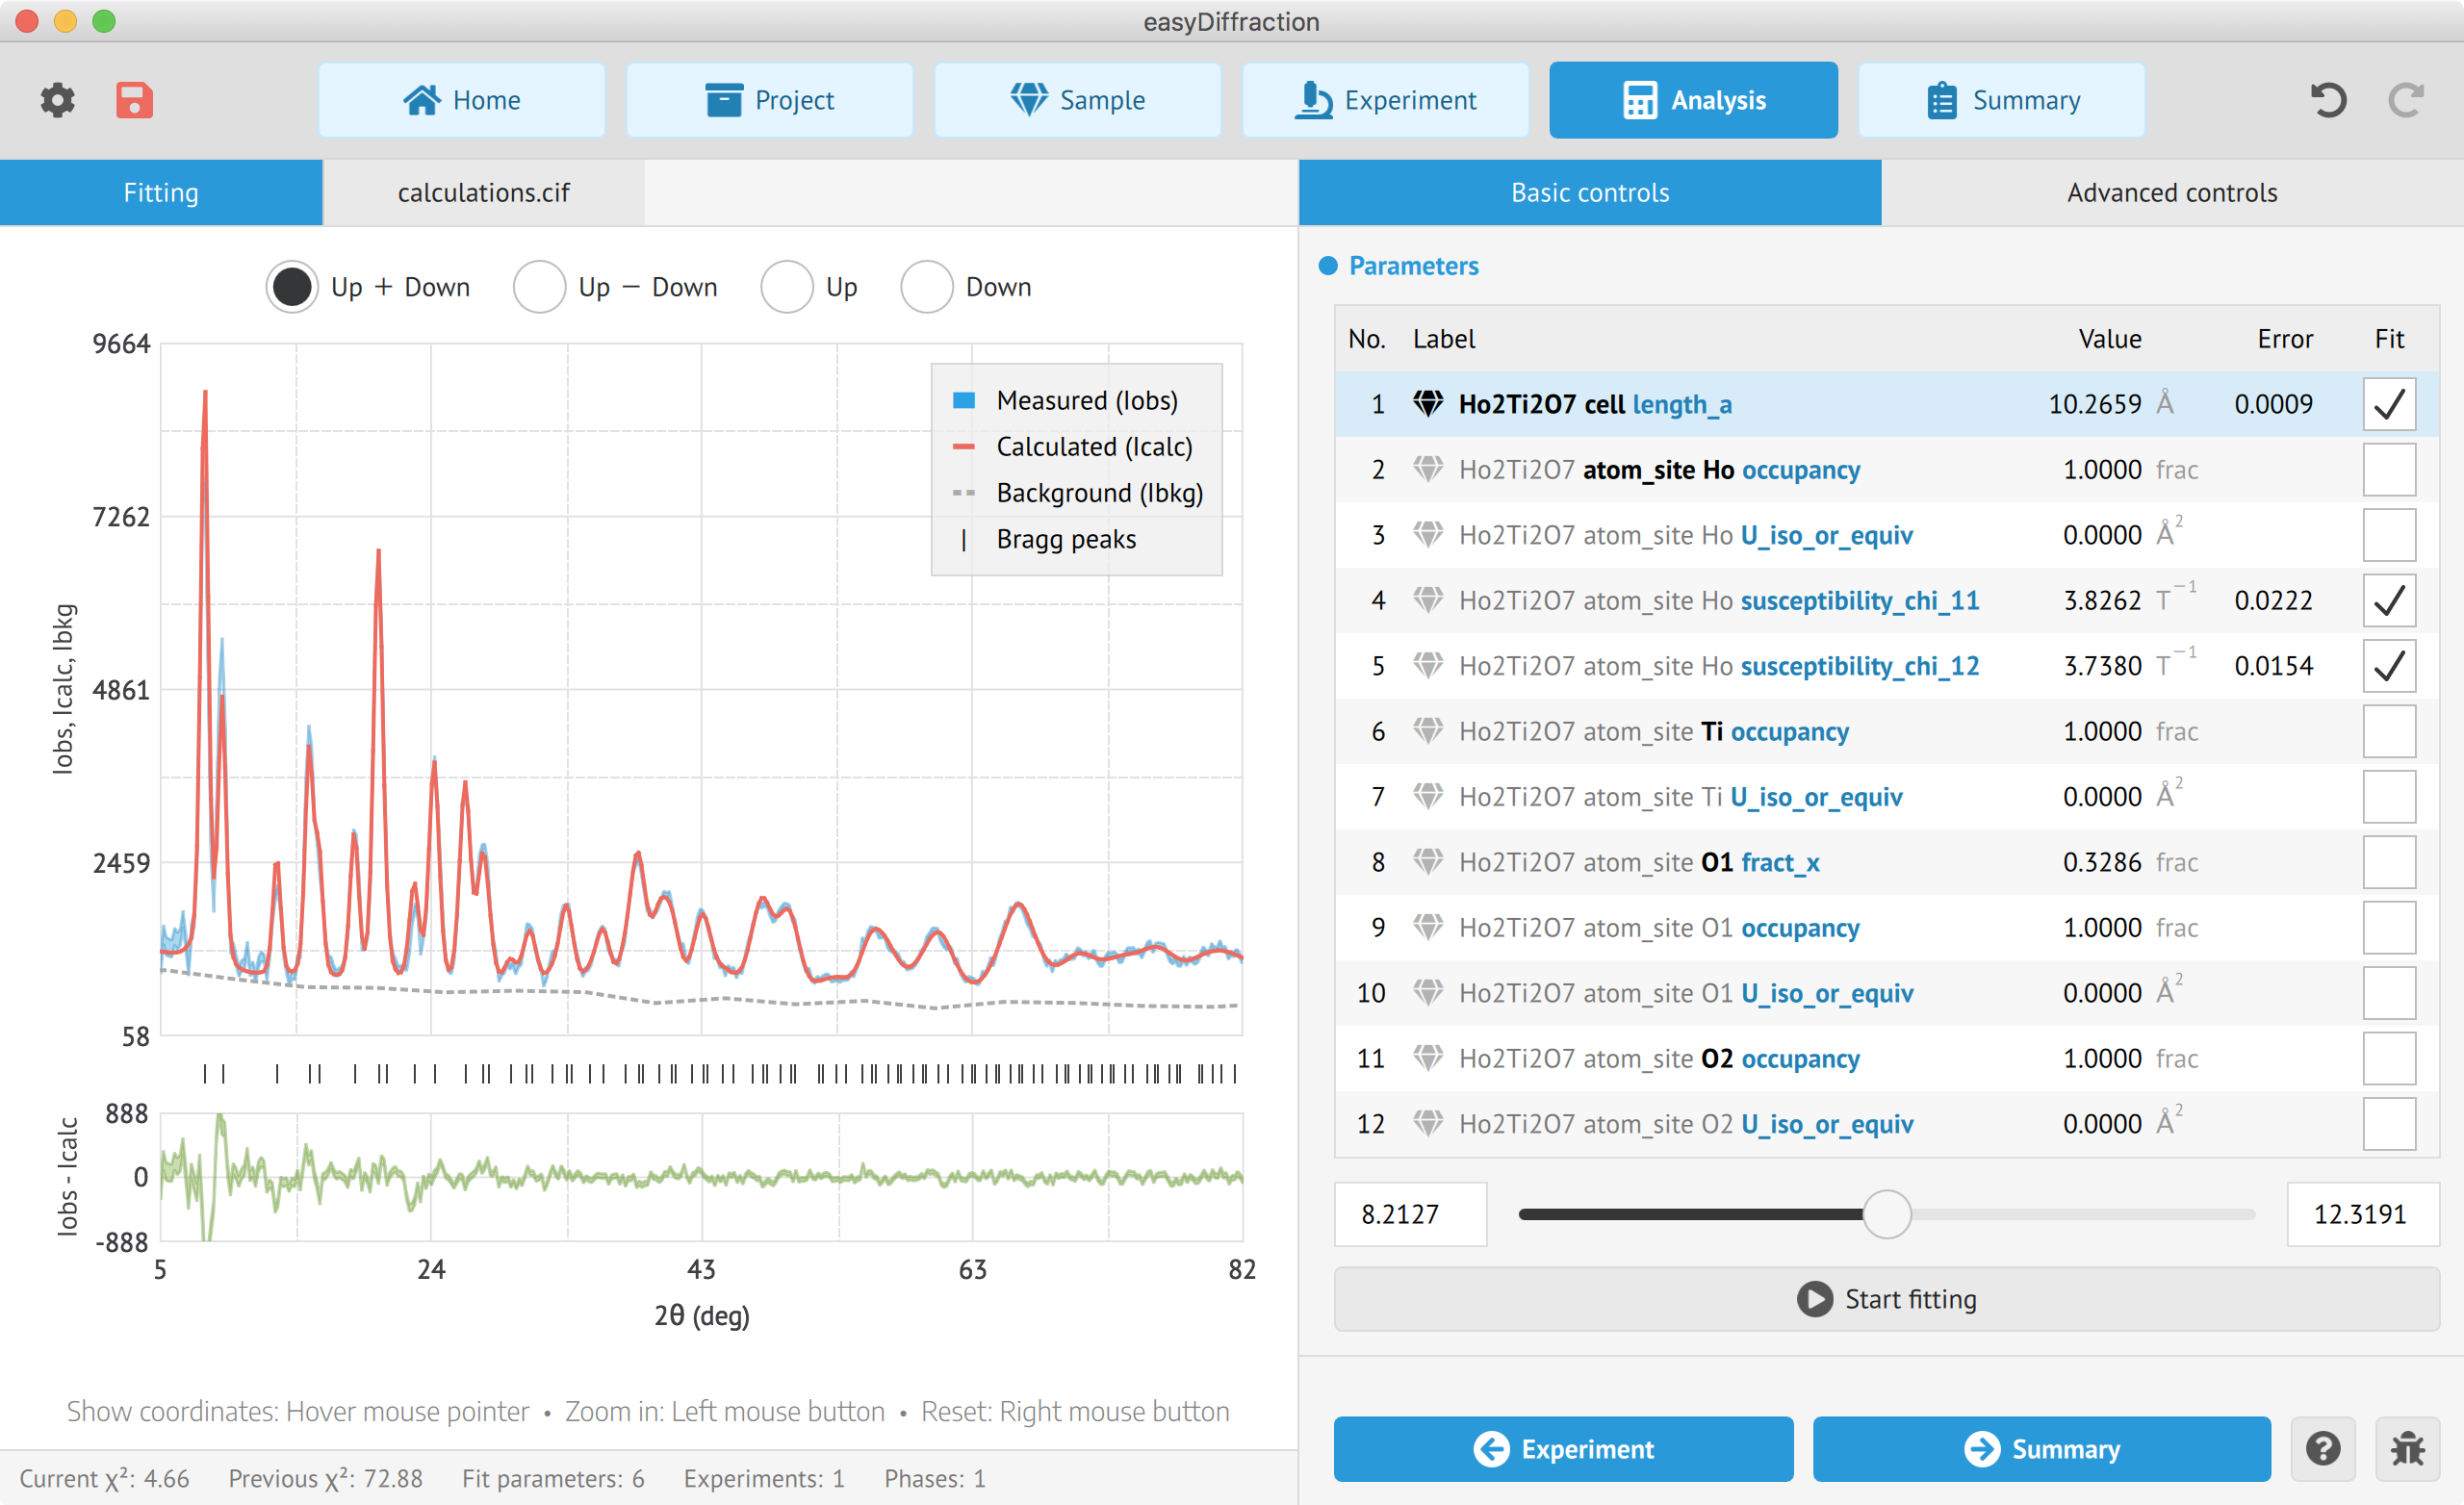
Fittingshows plot of the data and model using current parameters.Text Viewdisplays the results of structure refinement in the START/CIF format.
An interaction with the plot shown in the Fitting tab is performed as follows:
- View data point: Hover mouse over data point.
- Zoom in: Hold left click and drag a box over desired area.
- Reset view: Right mouse button.
Application sidebar
Each of the tabs of the main window have independent sidebar options.
The Fitting sidebar contains the following elements:
- Parameters group shows the table of parameters. Starting values are shown, along with units, standard deviation and a checkbox for selecting the variable for fitting.
- Start/Stop fitting button that initiates and stops fitting.
The Text View sidebar contains the following elements:
- Find Search in the CIF file (currently disabled).
The very bottom of the sidebar contains the following buttons of each tab:
Experimentto go to the previous step in the data processing.Summaryto go to the next step in the data processing.Get Online Helpfor the current tab.Report a bug or issueonline.
Application main window
The application's main window contains the following tabs:
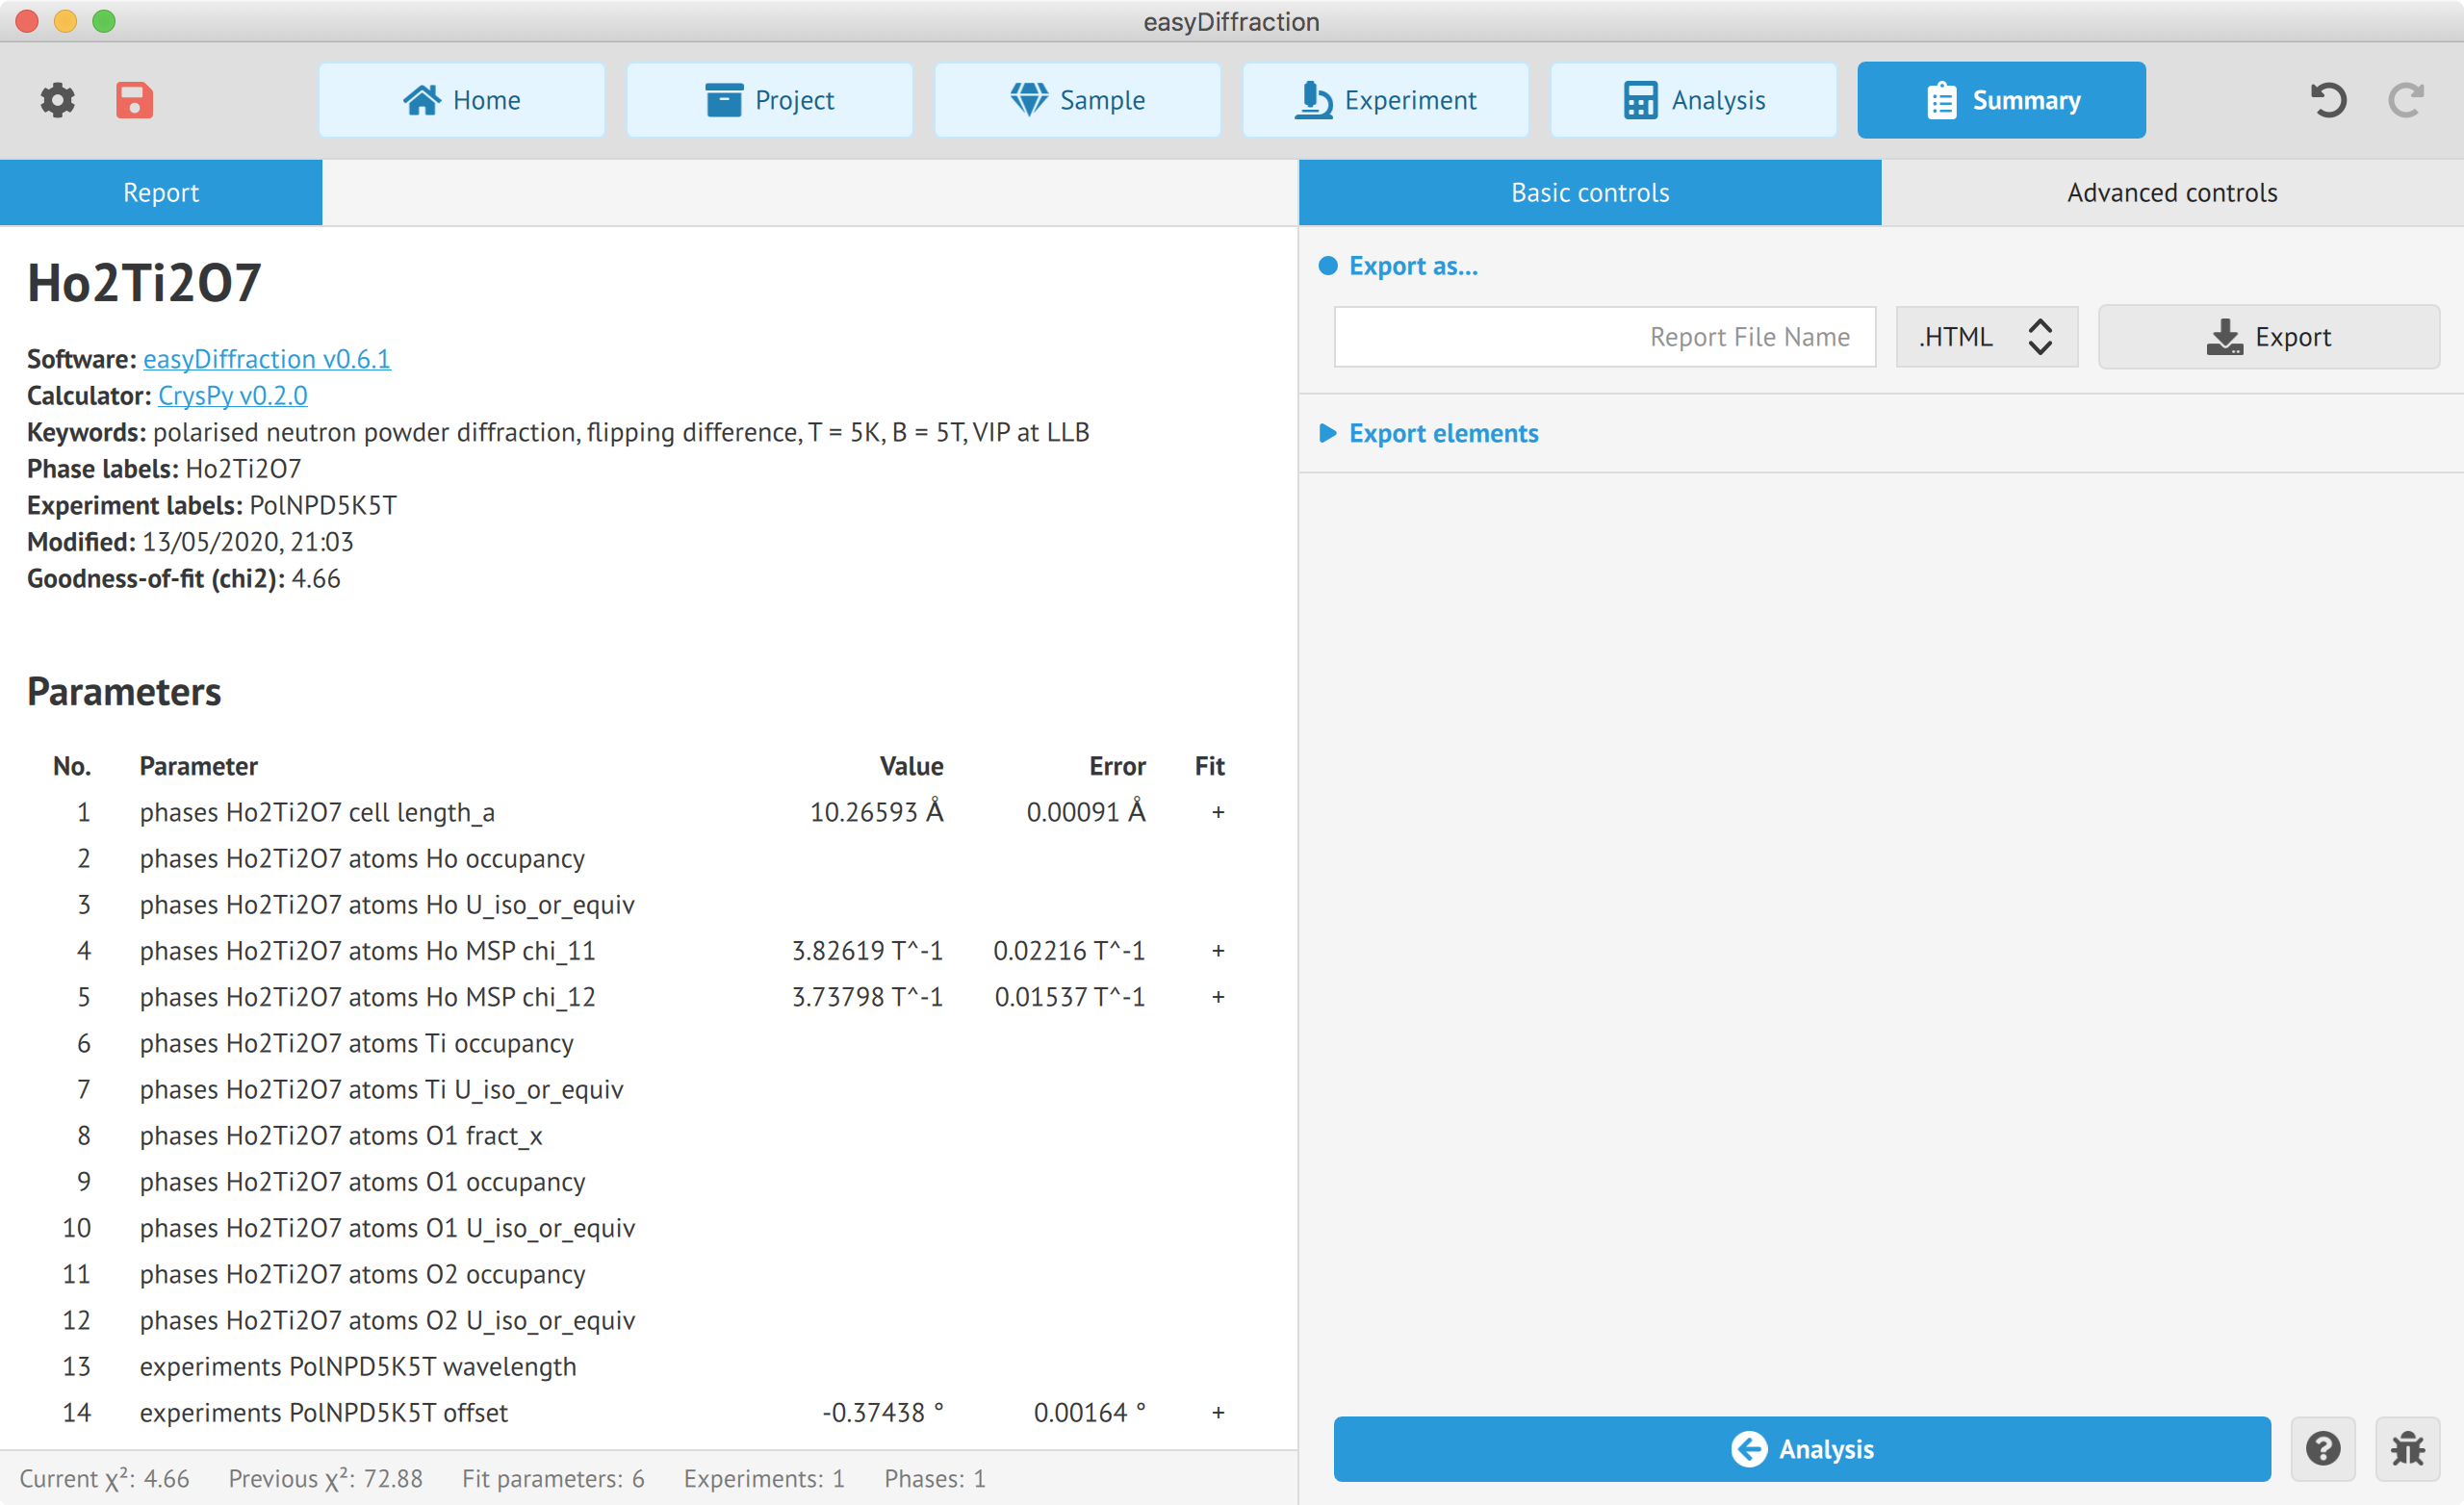
Reportshows the report for the performed data analysis.
The report contains the following:
- Project related information.
- Parameters displays table with all parameters.
- Fitting shows plot of data and model with current parameters.
- Structure contains 3D view of structure.
Application sidebar
The application's sidebar contains the following elements:
- Export as... contains export button, field for custom report name and drop down menu for file format.
- Export elements has checkboxes for each element in the report to select those that should be exported (currently disabled).
The very bottom of the sidebar contains the following buttons of each tab:
Analysisto go to the previous step in the data processing.Get Online Helpfor the current tab.Report a bug or issueonline.
